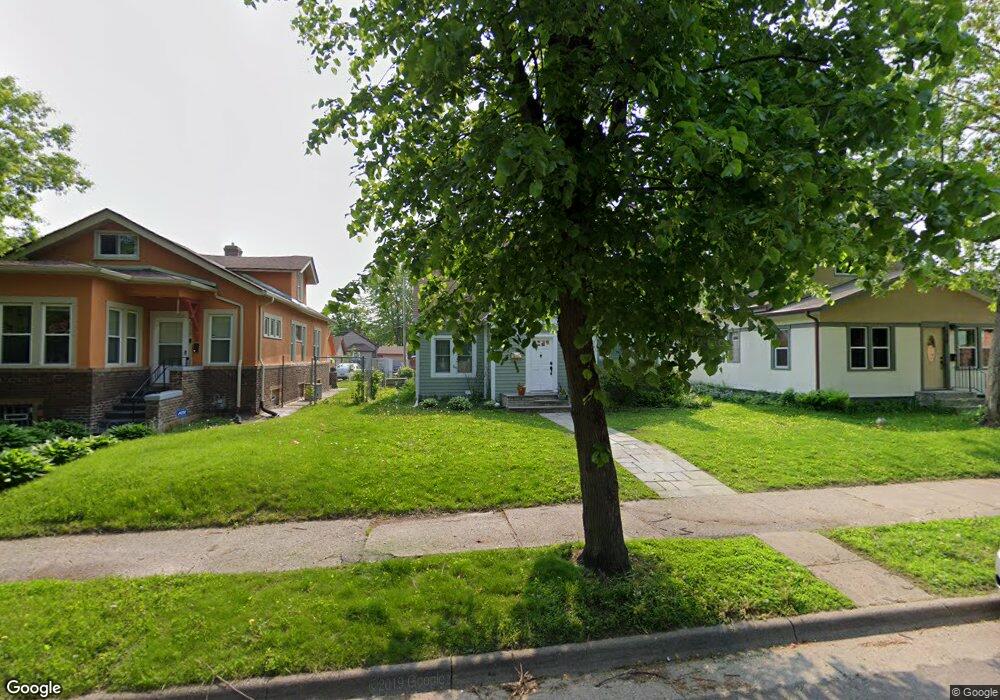
1316 Upton Ave N Minneapolis, MN 55411
Willard-Hay NeighborhoodEstimated Value: $271,053 - $369,000
4
Beds
2
Baths
1,693
Sq Ft
$180/Sq Ft
Est. Value
About This Home
This home is located at 1316 Upton Ave N, Minneapolis, MN 55411 and is currently estimated at $304,263, approximately $179 per square foot. 1316 Upton Ave N is a home located in Hennepin County with nearby schools including Bryn Mawr Elementary School, Anwatin Middle School, and North High School.
Ownership History
Date
Name
Owned For
Owner Type
Purchase Details
Closed on
Aug 25, 2022
Sold by
Joy Scheller Sarah and Joy Jeremy
Bought by
Scheller Sarah Joy and Scheller Jeremy
Current Estimated Value
Home Financials for this Owner
Home Financials are based on the most recent Mortgage that was taken out on this home.
Original Mortgage
$259,462
Outstanding Balance
$248,393
Interest Rate
5.51%
Mortgage Type
New Conventional
Estimated Equity
$55,870
Purchase Details
Closed on
Jun 18, 2003
Sold by
T H Parker Inc
Bought by
Scheller Sarah
Purchase Details
Closed on
Jan 24, 2003
Sold by
Hbc Enterprises
Bought by
T H Parker Inc
Purchase Details
Closed on
Feb 5, 1999
Sold by
Twin City Properties Inc
Bought by
Thomas Heather
Purchase Details
Closed on
Sep 9, 1997
Sold by
Haiden Donna M
Bought by
Twin City Properties Inc
Create a Home Valuation Report for This Property
The Home Valuation Report is an in-depth analysis detailing your home's value as well as a comparison with similar homes in the area
Home Values in the Area
Average Home Value in this Area
Purchase History
| Date | Buyer | Sale Price | Title Company |
|---|---|---|---|
| Scheller Sarah Joy | $3,000 | -- | |
| Scheller Sarah | $160,000 | -- | |
| T H Parker Inc | $880,000 | -- | |
| Thomas Heather | $62,900 | -- | |
| Twin City Properties Inc | $38,000 | -- |
Source: Public Records
Mortgage History
| Date | Status | Borrower | Loan Amount |
|---|---|---|---|
| Open | Scheller Sarah Joy | $259,462 | |
| Closed | Twin City Properties Inc | -- |
Source: Public Records
Tax History Compared to Growth
Tax History
| Year | Tax Paid | Tax Assessment Tax Assessment Total Assessment is a certain percentage of the fair market value that is determined by local assessors to be the total taxable value of land and additions on the property. | Land | Improvement |
|---|---|---|---|---|
| 2024 | $3,730 | $272,000 | $22,000 | $250,000 |
| 2023 | $3,414 | $274,000 | $22,000 | $252,000 |
| 2022 | $2,984 | $250,000 | $16,000 | $234,000 |
| 2021 | $2,638 | $231,000 | $11,000 | $220,000 |
| 2020 | $2,557 | $214,000 | $15,500 | $198,500 |
| 2019 | $2,578 | $194,500 | $10,300 | $184,200 |
| 2018 | $2,283 | $177,000 | $10,300 | $166,700 |
| 2017 | $2,242 | $152,000 | $9,400 | $142,600 |
| 2016 | $2,049 | $136,500 | $9,400 | $127,100 |
| 2015 | $2,018 | $129,500 | $9,400 | $120,100 |
| 2014 | -- | $129,500 | $9,400 | $120,100 |
Source: Public Records
Map
Nearby Homes
- 2600 Plymouth Ave N Unit A
- 1332 Upton Ave N
- 1411 Upton Ave N
- 1336 Russell Ave N
- 1423 Upton Ave N
- 1400 Queen Ave N
- 1423 Penn Ave N
- 1214 Penn Ave N
- 819 Sheridan Ave N
- 905 Queen Ave N
- 918 Queen Ave N
- 1519 Oliver Ave N
- 811 Queen Ave N
- 1211 Morgan Ave N
- 1429 Morgan Ave N
- 1722 Queen Ave N
- 2604 Golden Valley Rd
- 1800 Penn Ave N
- 2817 Golden Valley Rd
- 615 Russell Ave N
- 1320 Upton Ave N
- 1312 Upton Ave N
- 1324 Upton Ave N
- 1328 Upton Ave N
- 2622 Plymouth Ave N
- 2616 Plymouth Ave N
- 1317 Thomas Ave N
- 2626 Plymouth Ave N
- 1321 Thomas Ave N
- 1311 Thomas Ave N
- 2612 Plymouth Ave N
- 1325 Thomas Ave N
- 2608 Plymouth Ave N
- 1315 Upton Ave N
- 1329 Thomas Ave N
- 1319 Upton Ave N
- 2606 Plymouth Ave N
- 1336 Upton Ave N
- 1329 Upton Ave N
- 1331 Thomas Ave N