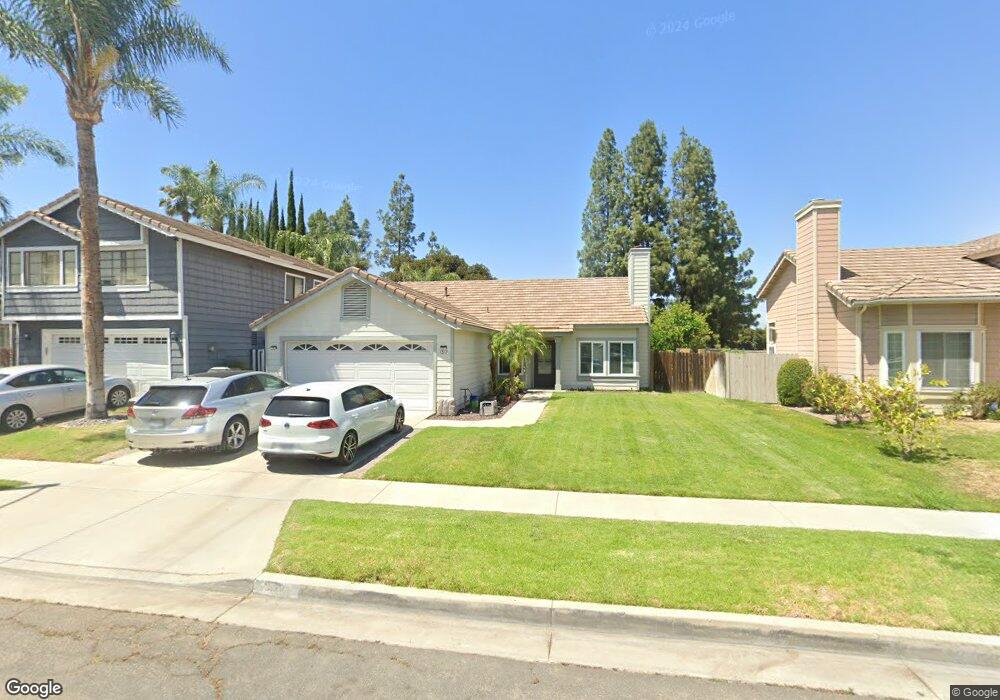
1317 Mahogany St Corona, CA 92882
Central Corona NeighborhoodEstimated Value: $674,366 - $731,000
3
Beds
2
Baths
1,342
Sq Ft
$525/Sq Ft
Est. Value
About This Home
This home is located at 1317 Mahogany St, Corona, CA 92882 and is currently estimated at $704,592, approximately $525 per square foot. 1317 Mahogany St is a home located in Riverside County with nearby schools including Benjamin Franklin Elementary School, Letha Raney Intermediate School, and Corona High School.
Ownership History
Date
Name
Owned For
Owner Type
Purchase Details
Closed on
Jan 18, 2008
Sold by
Cary Randy L and Wanchan Cary Nopsiri
Bought by
Cary Randy L
Current Estimated Value
Home Financials for this Owner
Home Financials are based on the most recent Mortgage that was taken out on this home.
Original Mortgage
$292,000
Outstanding Balance
$183,643
Interest Rate
6.09%
Mortgage Type
New Conventional
Estimated Equity
$520,949
Purchase Details
Closed on
Jun 15, 2000
Sold by
Aghakazem Shirazi Mostafa and Aghakazem Shirazi Epifania
Bought by
Cary Randy
Home Financials for this Owner
Home Financials are based on the most recent Mortgage that was taken out on this home.
Original Mortgage
$181,560
Interest Rate
8.55%
Mortgage Type
VA
Purchase Details
Closed on
Apr 7, 1998
Sold by
Aghakazem Shirazi Mostafa and Aghakazem Shirazi Ep
Bought by
Shirazi Mostafa and Shirazi Epifania
Create a Home Valuation Report for This Property
The Home Valuation Report is an in-depth analysis detailing your home's value as well as a comparison with similar homes in the area
Home Values in the Area
Average Home Value in this Area
Purchase History
| Date | Buyer | Sale Price | Title Company |
|---|---|---|---|
| Cary Randy L | -- | First American Title Company | |
| Cary Randy L | -- | First American Title Company | |
| Cary Randy | $178,000 | American Title Co | |
| Shirazi Mostafa | -- | -- |
Source: Public Records
Mortgage History
| Date | Status | Borrower | Loan Amount |
|---|---|---|---|
| Open | Cary Randy L | $292,000 | |
| Closed | Cary Randy | $181,560 |
Source: Public Records
Tax History Compared to Growth
Tax History
| Year | Tax Paid | Tax Assessment Tax Assessment Total Assessment is a certain percentage of the fair market value that is determined by local assessors to be the total taxable value of land and additions on the property. | Land | Improvement |
|---|---|---|---|---|
| 2025 | $3,035 | $268,187 | $75,328 | $192,859 |
| 2023 | $3,035 | $257,774 | $72,403 | $185,371 |
| 2022 | $2,941 | $252,721 | $70,984 | $181,737 |
| 2021 | $2,884 | $247,767 | $69,593 | $178,174 |
| 2020 | $2,853 | $245,228 | $68,880 | $176,348 |
| 2019 | $2,790 | $240,421 | $67,530 | $172,891 |
| 2018 | $2,729 | $235,707 | $66,206 | $169,501 |
| 2017 | $2,664 | $231,086 | $64,908 | $166,178 |
| 2016 | $2,639 | $226,556 | $63,636 | $162,920 |
| 2015 | $2,583 | $223,155 | $62,681 | $160,474 |
| 2014 | $2,493 | $218,786 | $61,454 | $157,332 |
Source: Public Records
Map
Nearby Homes
- 1365 Kroonen Dr
- 1284 Mayfair Dr
- 1317 Sonora Dr
- 1310 Brentwood Cir Unit B
- 1598 Border Ave Unit H
- 1344 Brentwood Cir Unit C
- 1361 Camelot Dr
- 1505 Camelot Dr
- 1486 Baird St
- 1194 Border Ave Unit A
- 1558 Camelot Dr
- 1514 Via Del Rio
- 1533 Camelot Dr
- 1382 Via Santiago
- 1313 Via Santiago Unit A
- 1317 Via Santiago
- 1187 Zircon St
- 1733 Bern Dr
- 1107 Border Ave
- 1396 Thornwood Square
- 1309 Mahogany St
- 1325 Mahogany St
- 1333 Mahogany St
- 1301 Mahogany St
- 1341 Mahogany St
- 1812 Butternut St
- 1813 Butternut St
- 1349 Mahogany St
- 1813 Pecan Cir
- 1821 Butternut St
- 1820 Butternut St
- 1357 Mahogany St
- 1821 Pecan Cir
- 1295 Biltmore Cir
- 1827 Butternut St
- 1828 Butternut St
- 1298 Biltmore Cir
- 1827 Pecan Cir
- 1296 Marriott Cir
- 1836 Butternut St