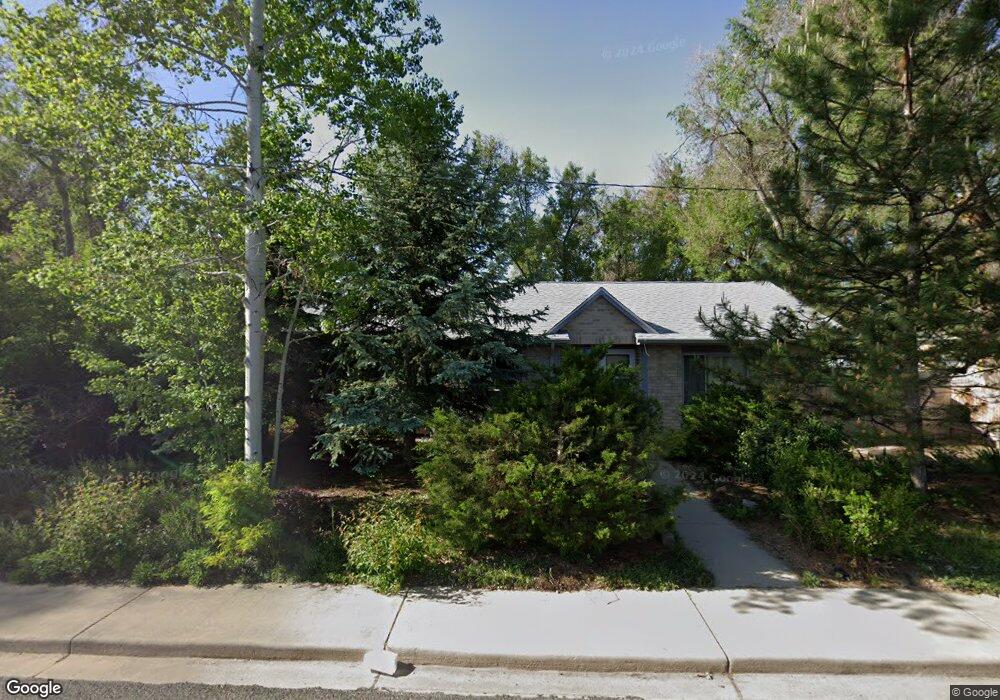
1319 11th Ave Longmont, CO 80501
Loomiller NeighborhoodEstimated Value: $490,000 - $525,000
2
Beds
2
Baths
1,198
Sq Ft
$421/Sq Ft
Est. Value
About This Home
This home is located at 1319 11th Ave, Longmont, CO 80501 and is currently estimated at $504,303, approximately $420 per square foot. 1319 11th Ave is a home located in Boulder County with nearby schools including Mountain View Elementary School, Longs Peak Middle School, and Longmont High School.
Ownership History
Date
Name
Owned For
Owner Type
Purchase Details
Closed on
Jun 7, 2017
Sold by
Mccray Irene Linn
Bought by
Mccary Irene Linn
Current Estimated Value
Purchase Details
Closed on
Sep 22, 2003
Sold by
Mcclung Dolores A
Bought by
Mccray Irene
Home Financials for this Owner
Home Financials are based on the most recent Mortgage that was taken out on this home.
Original Mortgage
$90,000
Outstanding Balance
$41,751
Interest Rate
6.24%
Mortgage Type
Purchase Money Mortgage
Estimated Equity
$462,552
Purchase Details
Closed on
Sep 19, 2003
Sold by
Mccray Joyce L
Bought by
Mccray Irene
Home Financials for this Owner
Home Financials are based on the most recent Mortgage that was taken out on this home.
Original Mortgage
$90,000
Outstanding Balance
$41,751
Interest Rate
6.24%
Mortgage Type
Purchase Money Mortgage
Estimated Equity
$462,552
Purchase Details
Closed on
Nov 1, 1996
Sold by
Stockman Clara L
Bought by
Mccray Joyce L
Purchase Details
Closed on
Nov 17, 1995
Sold by
Weisgerber Verna Lena
Bought by
Stockman Clara L
Purchase Details
Closed on
Dec 10, 1993
Sold by
Ramos Constantino Jose and Ramos Virginia C
Bought by
Weisgerber Verna Lena
Purchase Details
Closed on
Jul 2, 1992
Bought by
Mccray Irene
Create a Home Valuation Report for This Property
The Home Valuation Report is an in-depth analysis detailing your home's value as well as a comparison with similar homes in the area
Home Values in the Area
Average Home Value in this Area
Purchase History
| Date | Buyer | Sale Price | Title Company |
|---|---|---|---|
| Mccary Irene Linn | -- | None Available | |
| Mccray Irene | -- | -- | |
| Mccray Irene | -- | -- | |
| Mccray Joyce L | -- | -- | |
| Stockman Clara L | $137,000 | -- | |
| Weisgerber Verna Lena | $105,000 | -- | |
| Mccray Irene | $85,000 | -- |
Source: Public Records
Mortgage History
| Date | Status | Borrower | Loan Amount |
|---|---|---|---|
| Open | Mccray Irene | $90,000 | |
| Closed | Mccray Irene | $90,000 |
Source: Public Records
Tax History Compared to Growth
Tax History
| Year | Tax Paid | Tax Assessment Tax Assessment Total Assessment is a certain percentage of the fair market value that is determined by local assessors to be the total taxable value of land and additions on the property. | Land | Improvement |
|---|---|---|---|---|
| 2025 | $2,849 | $30,188 | $5,525 | $24,663 |
| 2024 | $2,849 | $30,188 | $5,525 | $24,663 |
| 2023 | $2,810 | $29,782 | $6,177 | $27,289 |
| 2022 | $2,517 | $25,437 | $4,545 | $20,892 |
| 2021 | $2,550 | $26,169 | $4,676 | $21,493 |
| 2020 | $2,218 | $22,838 | $4,076 | $18,762 |
| 2019 | $2,184 | $22,838 | $4,076 | $18,762 |
| 2018 | $1,866 | $19,642 | $3,672 | $15,970 |
| 2017 | $1,840 | $21,715 | $4,060 | $17,655 |
| 2016 | $1,599 | $16,732 | $4,935 | $11,797 |
| 2015 | $1,524 | $14,678 | $4,537 | $10,141 |
| 2014 | $1,371 | $14,678 | $4,537 | $10,141 |
Source: Public Records
Map
Nearby Homes
- 931 Venice St
- 1136 Venice St
- 1214 9th Ave
- 1209 Gay St
- 1217 Lincoln St
- 1012 Pratt St Unit 1012
- 1247 Lincoln St
- 818 Lincoln St
- 1019 Alta St Unit 1019
- 814 Gay St
- 1314 Venice St
- 1224 Judson St
- 1202 Vivian St
- 1344 Aspen Place
- 1061 Townley Cir
- 813 Vivian St
- 900 Mountain View Ave Unit 213
- 900 Mountain View Ave Unit 217
- 1321 Judson St
- 1208 Juniper St