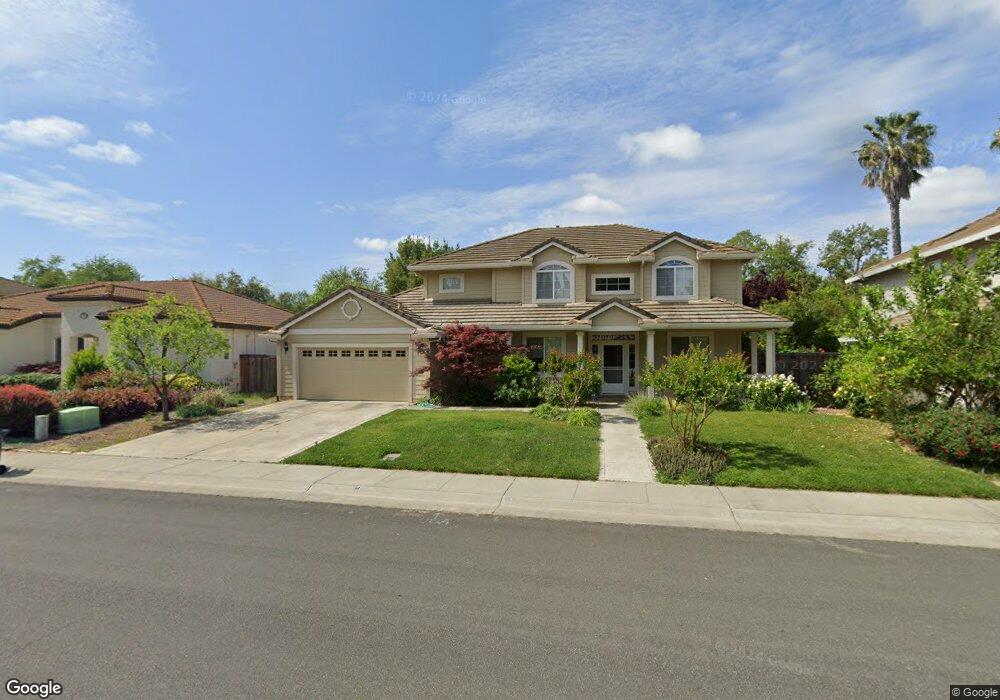
1319 Arena Dr Davis, CA 95618
East Davis NeighborhoodEstimated Value: $950,000 - $1,352,000
5
Beds
3
Baths
2,692
Sq Ft
$407/Sq Ft
Est. Value
About This Home
This home is located at 1319 Arena Dr, Davis, CA 95618 and is currently estimated at $1,095,549, approximately $406 per square foot. 1319 Arena Dr is a home located in Yolo County with nearby schools including Fred T. Korematsu Elementary School At Mace Ranch, Frances Ellen Watkins Harper Junior High School, and Davis Senior High School.
Ownership History
Date
Name
Owned For
Owner Type
Purchase Details
Closed on
Aug 2, 2010
Sold by
White Stephen D and White Roni H
Bought by
White Stephen D and White Roni H
Current Estimated Value
Home Financials for this Owner
Home Financials are based on the most recent Mortgage that was taken out on this home.
Original Mortgage
$372,000
Outstanding Balance
$245,679
Interest Rate
4.52%
Mortgage Type
New Conventional
Estimated Equity
$849,870
Purchase Details
Closed on
Oct 27, 2005
Sold by
White Stephen D and White Roni H
Bought by
White Stephen D and White Roni H
Purchase Details
Closed on
Sep 21, 1998
Sold by
Smith Jeffrey B and Meagher Christina D
Bought by
White Stephen D and White Roni H
Home Financials for this Owner
Home Financials are based on the most recent Mortgage that was taken out on this home.
Original Mortgage
$268,800
Interest Rate
6.88%
Create a Home Valuation Report for This Property
The Home Valuation Report is an in-depth analysis detailing your home's value as well as a comparison with similar homes in the area
Home Values in the Area
Average Home Value in this Area
Purchase History
| Date | Buyer | Sale Price | Title Company |
|---|---|---|---|
| White Stephen D | -- | Chicago Title Company | |
| White Stephen D | -- | Chicago Title Company | |
| White Stephen D | -- | -- | |
| White Stephen D | $336,000 | Fidelity National Title Co |
Source: Public Records
Mortgage History
| Date | Status | Borrower | Loan Amount |
|---|---|---|---|
| Open | White Stephen D | $372,000 | |
| Closed | White Stephen D | $268,800 |
Source: Public Records
Tax History
| Year | Tax Paid | Tax Assessment Tax Assessment Total Assessment is a certain percentage of the fair market value that is determined by local assessors to be the total taxable value of land and additions on the property. | Land | Improvement |
|---|---|---|---|---|
| 2025 | $9,018 | $583,571 | $148,920 | $434,651 |
| 2023 | $9,018 | $560,912 | $143,138 | $417,774 |
| 2022 | $8,758 | $549,915 | $140,332 | $409,583 |
| 2021 | $8,607 | $539,133 | $137,581 | $401,552 |
| 2020 | $8,489 | $533,606 | $136,171 | $397,435 |
| 2019 | $8,182 | $523,144 | $133,501 | $389,643 |
| 2018 | $7,719 | $512,887 | $130,884 | $382,003 |
| 2017 | $7,597 | $502,831 | $128,318 | $374,513 |
| 2016 | $7,457 | $492,972 | $125,802 | $367,170 |
| 2015 | $7,222 | $485,568 | $123,913 | $361,655 |
| 2014 | $7,222 | $476,057 | $121,486 | $354,571 |
Source: Public Records
Map
Nearby Homes
- 3224 Via Verde Terrace
- 2807 Layton Dr
- 1421 Vigo Ct
- 1120 Colina Ct
- 1619 Monarch Ln
- 4410 Frontera Dr
- 1540 Pastal Way
- 1107 Baylor Terrace
- 1108 Baylor Terrace
- 1013 Vanderbilt Terrace
- 1007 Vanderbilt Terrace
- 1001 Vanderbilt Terrace
- 1049 Ginkgo Cir
- 217 La Vida Way
- 1013 Ginkgo Cir
- 1007 Ginkgo Cir
- 2385 Roualt St
- 1001 Ginkgo Cir
- 257 Quarter Cir
- 2307 E 8th St
- 1315 Arena Dr
- 1325 Arena Dr
- 1307 Arena Dr
- 1331 Arena Dr
- 1320 Arena Dr
- 3219 Conquistador Way
- 1301 Arena Dr
- 3309 La Playa Dr
- 3306 La Playa Dr
- 3225 Conquistador Way
- 3225 Conquistador (L 550)
- 592 La Playa Dr
- 591 La Playa Dr
- 588 La Playa Dr
- 589 La Playa Dr
- 562 La Playa Dr
- 563 La Playa Dr
- 565 La Playa Dr
- 567 La Playa Dr
- 568 La Playa Dr
Your Personal Tour Guide
Ask me questions while you tour the home.