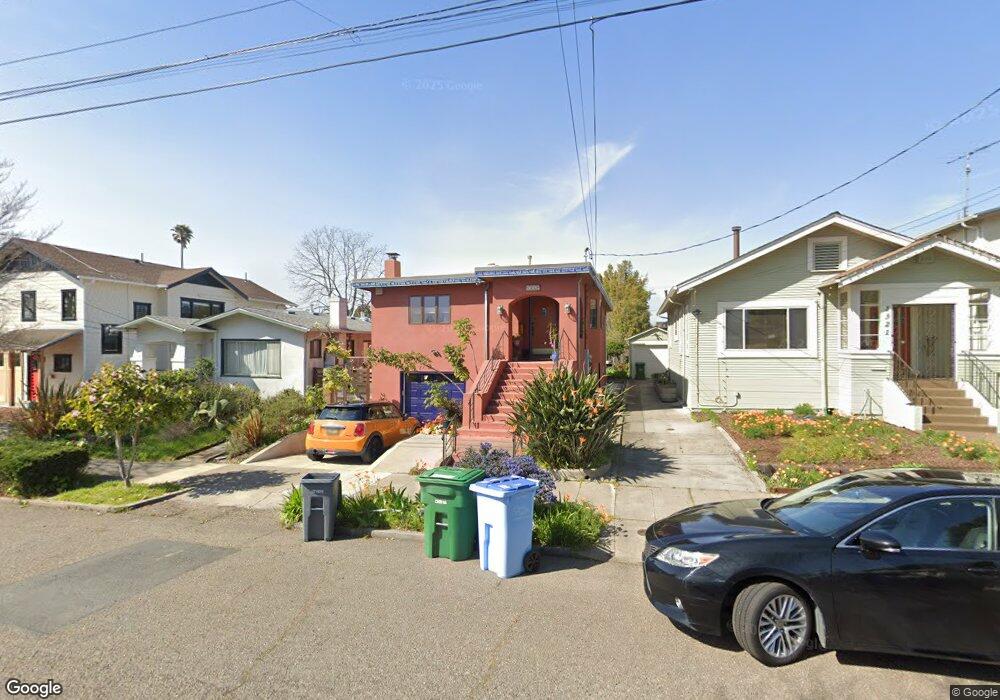
1319 Blake St Berkeley, CA 94702
West Berkeley NeighborhoodEstimated Value: $917,000 - $1,491,614
3
Beds
2
Baths
1,845
Sq Ft
$611/Sq Ft
Est. Value
About This Home
This home is located at 1319 Blake St, Berkeley, CA 94702 and is currently estimated at $1,127,404, approximately $611 per square foot. 1319 Blake St is a home located in Alameda County with nearby schools including Oxford Elementary School, Washington Elementary School, and Malcolm X Elementary School.
Ownership History
Date
Name
Owned For
Owner Type
Purchase Details
Closed on
Oct 20, 2003
Sold by
Harralson William S
Bought by
Stassinos Martha
Current Estimated Value
Home Financials for this Owner
Home Financials are based on the most recent Mortgage that was taken out on this home.
Original Mortgage
$315,200
Outstanding Balance
$146,384
Interest Rate
6.14%
Mortgage Type
Unknown
Estimated Equity
$981,020
Create a Home Valuation Report for This Property
The Home Valuation Report is an in-depth analysis detailing your home's value as well as a comparison with similar homes in the area
Home Values in the Area
Average Home Value in this Area
Purchase History
| Date | Buyer | Sale Price | Title Company |
|---|---|---|---|
| Stassinos Martha | $394,000 | Placer Title Company |
Source: Public Records
Mortgage History
| Date | Status | Borrower | Loan Amount |
|---|---|---|---|
| Open | Stassinos Martha | $315,200 | |
| Closed | Stassinos Martha | $59,100 |
Source: Public Records
Tax History
| Year | Tax Paid | Tax Assessment Tax Assessment Total Assessment is a certain percentage of the fair market value that is determined by local assessors to be the total taxable value of land and additions on the property. | Land | Improvement |
|---|---|---|---|---|
| 2025 | $11,477 | $692,591 | $168,046 | $531,545 |
| 2024 | $11,477 | $678,875 | $164,751 | $521,124 |
| 2023 | $11,229 | $672,428 | $161,521 | $510,907 |
| 2022 | $11,007 | $652,245 | $158,354 | $500,891 |
| 2021 | $11,017 | $639,322 | $155,250 | $491,072 |
| 2020 | $10,380 | $639,700 | $153,660 | $486,040 |
| 2019 | $9,312 | $561,156 | $150,647 | $410,509 |
| 2018 | $7,901 | $492,310 | $147,693 | $344,617 |
| 2017 | $7,609 | $482,657 | $144,797 | $337,860 |
| 2016 | $7,329 | $473,193 | $141,958 | $331,235 |
| 2015 | $7,226 | $466,085 | $139,825 | $326,260 |
| 2014 | $7,163 | $456,957 | $137,087 | $319,870 |
Source: Public Records
Map
Nearby Homes
- 1142 Dwight Way
- 1118 Dwight Way
- 2324 Browning St
- 1515 Derby St
- 1092 Dwight Way
- 1450 Ward St
- 2750 Sacramento St
- 2758 Sacramento St
- 2774 Sacramento St
- 2782 Sacramento St
- 1612 Parker St
- 2790 Sacramento St
- 1612 Carleton St
- 1039 Channing Way
- 2751 Wallace St
- 2747 San Pablo Ave Unit 507
- 2231 Byron St
- 2327 10th St Unit 4
- 1645 Dwight Way
- 1530 Stuart St
Your Personal Tour Guide
Ask me questions while you tour the home.