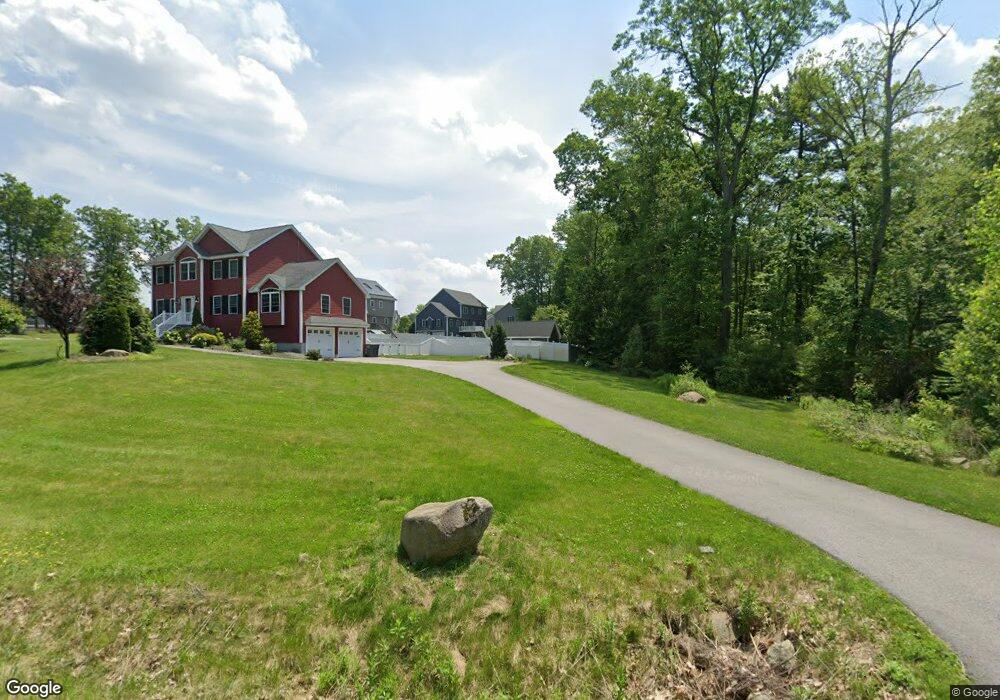
132 Clement Rd Pelham, NH 03076
Estimated Value: $823,772 - $930,000
3
Beds
4
Baths
2,448
Sq Ft
$356/Sq Ft
Est. Value
About This Home
This home is located at 132 Clement Rd, Pelham, NH 03076 and is currently estimated at $872,443, approximately $356 per square foot. 132 Clement Rd is a home located in Hillsborough County with nearby schools including Pelham Elementary School, Pelham Memorial School, and Pelham High School.
Ownership History
Date
Name
Owned For
Owner Type
Purchase Details
Closed on
Aug 11, 2020
Sold by
Williams Mollie M and Williams Michael L
Bought by
Encarnacao Tracy K
Current Estimated Value
Home Financials for this Owner
Home Financials are based on the most recent Mortgage that was taken out on this home.
Original Mortgage
$395,000
Outstanding Balance
$350,393
Interest Rate
3%
Mortgage Type
New Conventional
Estimated Equity
$522,050
Purchase Details
Closed on
Mar 16, 2018
Sold by
Southern End Realty Ll
Bought by
Williams Mollie M and Williams Michael L
Home Financials for this Owner
Home Financials are based on the most recent Mortgage that was taken out on this home.
Original Mortgage
$445,500
Interest Rate
4.22%
Mortgage Type
New Conventional
Create a Home Valuation Report for This Property
The Home Valuation Report is an in-depth analysis detailing your home's value as well as a comparison with similar homes in the area
Home Values in the Area
Average Home Value in this Area
Purchase History
| Date | Buyer | Sale Price | Title Company |
|---|---|---|---|
| Encarnacao Tracy K | $575,000 | None Available | |
| Williams Mollie M | $495,000 | -- |
Source: Public Records
Mortgage History
| Date | Status | Borrower | Loan Amount |
|---|---|---|---|
| Open | Encarnacao Tracy K | $395,000 | |
| Previous Owner | Williams Mollie M | $445,500 |
Source: Public Records
Tax History Compared to Growth
Tax History
| Year | Tax Paid | Tax Assessment Tax Assessment Total Assessment is a certain percentage of the fair market value that is determined by local assessors to be the total taxable value of land and additions on the property. | Land | Improvement |
|---|---|---|---|---|
| 2024 | $13,331 | $726,900 | $165,800 | $561,100 |
| 2023 | $12,038 | $661,800 | $165,800 | $496,000 |
| 2022 | $11,529 | $661,800 | $165,800 | $496,000 |
| 2021 | $10,562 | $661,800 | $165,800 | $496,000 |
| 2020 | $10,284 | $509,100 | $132,700 | $376,400 |
| 2019 | $9,877 | $509,100 | $132,700 | $376,400 |
| 2018 | $9,799 | $456,600 | $132,700 | $323,900 |
| 2017 | $5,232 | $243,900 | $132,700 | $111,200 |
| 2016 | $2,780 | $132,700 | $132,700 | $0 |
| 2015 | $1,330 | $57,200 | $57,200 | $0 |
| 2014 | $1,308 | $57,200 | $57,200 | $0 |
| 2013 | $1,308 | $57,200 | $57,200 | $0 |
Source: Public Records
Map
Nearby Homes