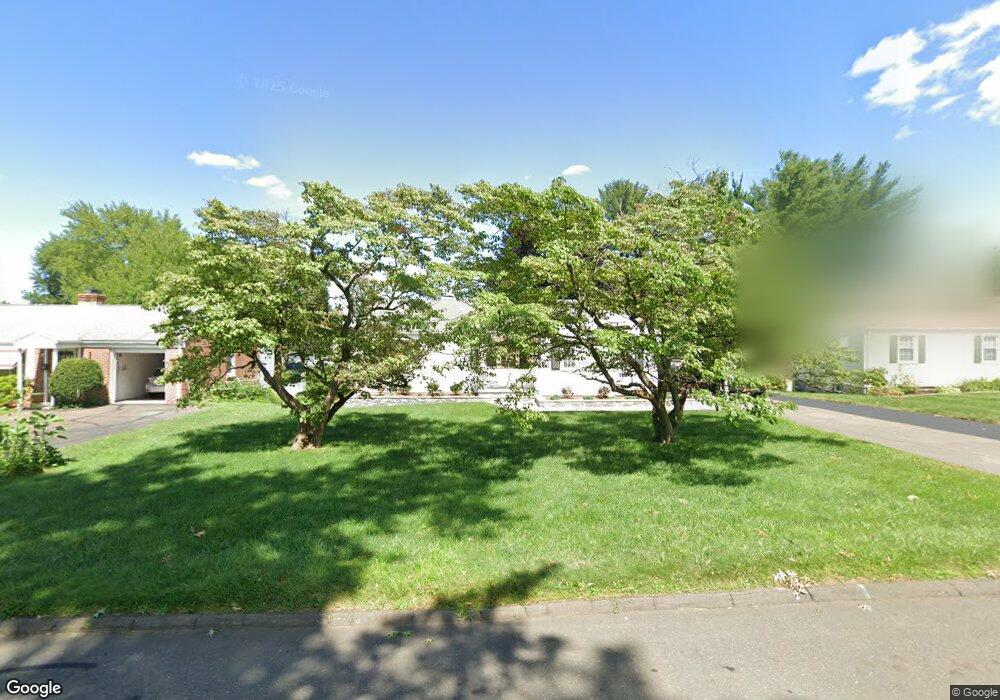
132 Mapleside Dr Wethersfield, CT 06109
Estimated Value: $360,425 - $384,000
3
Beds
1
Bath
1,166
Sq Ft
$318/Sq Ft
Est. Value
About This Home
This home is located at 132 Mapleside Dr, Wethersfield, CT 06109 and is currently estimated at $370,356, approximately $317 per square foot. 132 Mapleside Dr is a home located in Hartford County with nearby schools including Emerson-Williams School, Silas Deane Middle School, and Wethersfield High School.
Ownership History
Date
Name
Owned For
Owner Type
Purchase Details
Closed on
Nov 19, 2009
Sold by
Millman William J and Millman Rose V
Bought by
Weiss Robert A and Weiss Karen M
Current Estimated Value
Home Financials for this Owner
Home Financials are based on the most recent Mortgage that was taken out on this home.
Original Mortgage
$180,000
Interest Rate
4.86%
Create a Home Valuation Report for This Property
The Home Valuation Report is an in-depth analysis detailing your home's value as well as a comparison with similar homes in the area
Home Values in the Area
Average Home Value in this Area
Purchase History
| Date | Buyer | Sale Price | Title Company |
|---|---|---|---|
| Weiss Robert A | $180,000 | -- |
Source: Public Records
Mortgage History
| Date | Status | Borrower | Loan Amount |
|---|---|---|---|
| Open | Weiss Robert A | $85,000 | |
| Closed | Weiss Robert A | $180,000 |
Source: Public Records
Tax History
| Year | Tax Paid | Tax Assessment Tax Assessment Total Assessment is a certain percentage of the fair market value that is determined by local assessors to be the total taxable value of land and additions on the property. | Land | Improvement |
|---|---|---|---|---|
| 2025 | $9,493 | $230,290 | $94,740 | $135,550 |
| 2024 | $6,454 | $149,340 | $73,500 | $75,840 |
| 2023 | $6,239 | $149,340 | $73,500 | $75,840 |
| 2022 | $6,135 | $149,340 | $73,500 | $75,840 |
| 2021 | $6,074 | $149,340 | $73,500 | $75,840 |
| 2020 | $6,077 | $149,340 | $73,500 | $75,840 |
| 2019 | $6,084 | $149,340 | $73,500 | $75,840 |
| 2018 | $6,027 | $147,800 | $71,300 | $76,500 |
| 2017 | $5,878 | $147,800 | $71,300 | $76,500 |
| 2016 | $5,696 | $147,800 | $71,300 | $76,500 |
| 2015 | $5,644 | $147,800 | $71,300 | $76,500 |
| 2014 | $5,430 | $147,800 | $71,300 | $76,500 |
Source: Public Records
Map
Nearby Homes
Your Personal Tour Guide
Ask me questions while you tour the home.