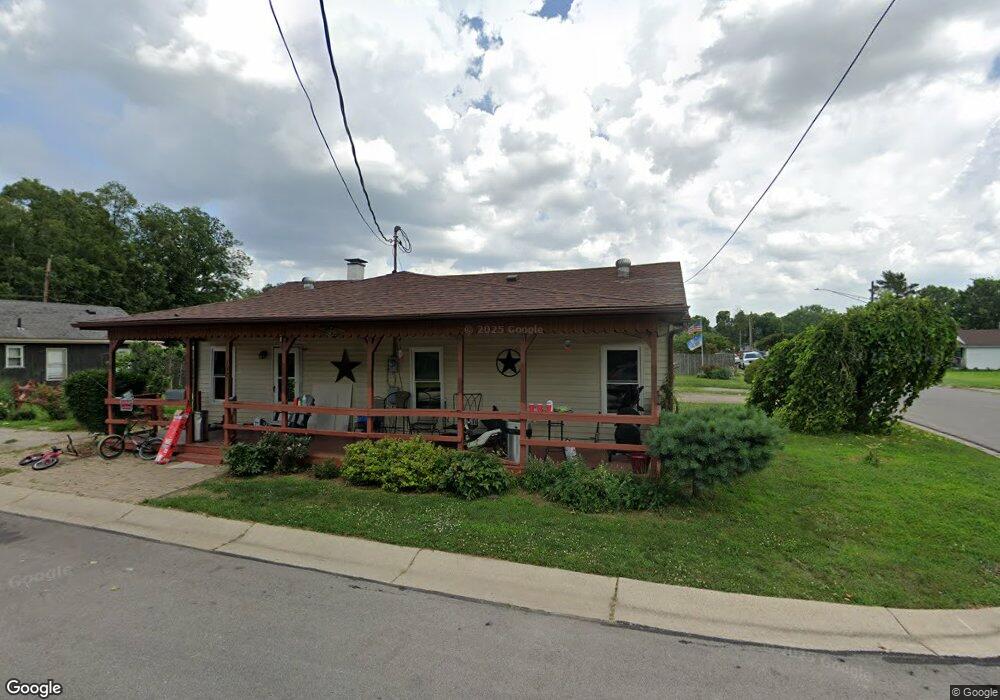
132 Sycamore St Franklin, OH 45005
Estimated Value: $95,249 - $154,000
3
Beds
1
Bath
1,040
Sq Ft
$123/Sq Ft
Est. Value
About This Home
This home is located at 132 Sycamore St, Franklin, OH 45005 and is currently estimated at $128,083, approximately $123 per square foot. 132 Sycamore St is a home located in Warren County with nearby schools including Franklin High School.
Ownership History
Date
Name
Owned For
Owner Type
Purchase Details
Closed on
Oct 12, 2024
Sold by
Collins Dorothy
Bought by
Napier Teresa
Current Estimated Value
Purchase Details
Closed on
Apr 19, 2023
Sold by
Napier Bill
Bought by
Collins Kernie L
Purchase Details
Closed on
Nov 24, 1999
Sold by
Napier Bill
Bought by
Napier Bill
Purchase Details
Closed on
Feb 15, 1990
Sold by
Napier Napier and Napier Gladys
Bought by
Napier Napier and Napier Bill
Purchase Details
Closed on
Oct 11, 1989
Sold by
Napier Napier and Napier Ed
Bought by
Napier Napier and Napier Gladys
Purchase Details
Closed on
Nov 1, 1985
Sold by
Person Person and Person Richard
Bought by
Napier Napier and Napier Ed
Purchase Details
Closed on
Aug 21, 1984
Sold by
Napier Napier and Napier L. P
Bought by
Person Person and Person Richard
Purchase Details
Closed on
Mar 7, 1984
Sold by
Willard Klaber and Willard P.
Bought by
Napier Napier and Napier L. P
Create a Home Valuation Report for This Property
The Home Valuation Report is an in-depth analysis detailing your home's value as well as a comparison with similar homes in the area
Home Values in the Area
Average Home Value in this Area
Purchase History
| Date | Buyer | Sale Price | Title Company |
|---|---|---|---|
| Napier Teresa | $50,000 | None Listed On Document | |
| Collins Kernie L | $50,000 | None Listed On Document | |
| Napier Bill | -- | -- | |
| Napier Bill | -- | -- | |
| Napier Napier | -- | -- | |
| Napier Napier | $10,000 | -- | |
| Napier Napier | $12,000 | -- | |
| Person Person | $10,000 | -- | |
| Napier Napier | $15,000 | -- |
Source: Public Records
Tax History
| Year | Tax Paid | Tax Assessment Tax Assessment Total Assessment is a certain percentage of the fair market value that is determined by local assessors to be the total taxable value of land and additions on the property. | Land | Improvement |
|---|---|---|---|---|
| 2025 | $998 | $20,350 | $2,350 | $18,000 |
| 2024 | $998 | $20,350 | $2,350 | $18,000 |
| 2023 | $872 | $16,089 | $2,268 | $13,821 |
| 2022 | $855 | $16,090 | $2,268 | $13,822 |
| 2021 | $811 | $16,090 | $2,268 | $13,822 |
| 2020 | $779 | $13,636 | $1,922 | $11,715 |
| 2019 | $711 | $13,636 | $1,922 | $11,715 |
| 2018 | $712 | $13,636 | $1,922 | $11,715 |
| 2017 | $767 | $13,444 | $1,925 | $11,519 |
| 2016 | $782 | $13,444 | $1,925 | $11,519 |
| 2015 | $782 | $13,444 | $1,925 | $11,519 |
| 2014 | $421 | $13,440 | $1,930 | $11,520 |
| 2013 | $675 | $14,900 | $2,140 | $12,760 |
Source: Public Records
Map
Nearby Homes
Your Personal Tour Guide
Ask me questions while you tour the home.