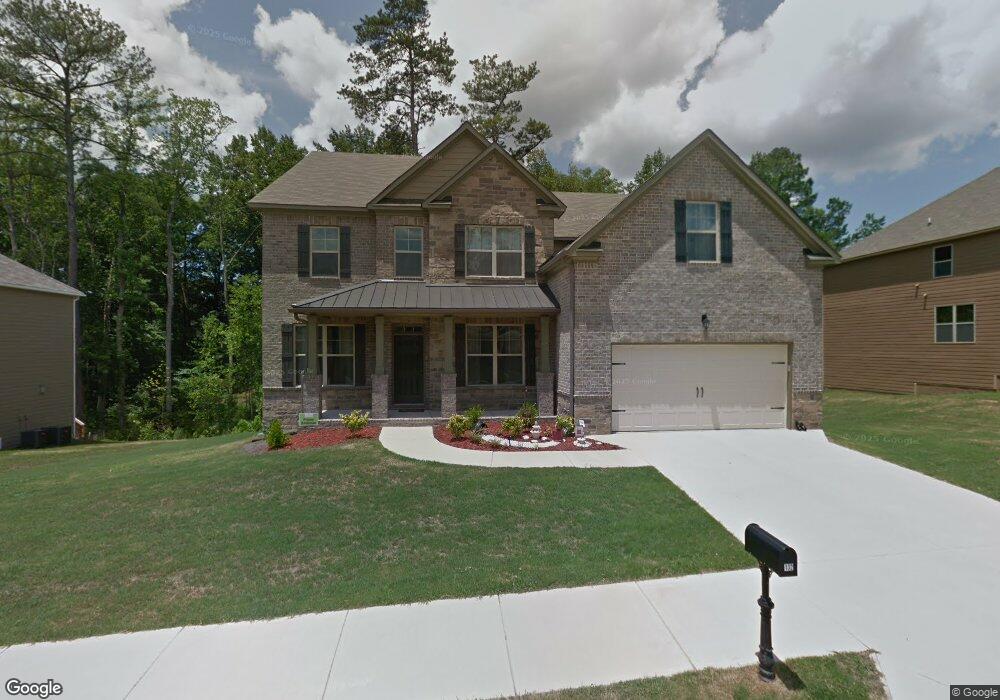
132 Tumble Run Unit 6 Stockbridge, GA 30281
Estimated Value: $486,000 - $518,000
4
Beds
4
Baths
3,996
Sq Ft
$126/Sq Ft
Est. Value
About This Home
This home is located at 132 Tumble Run Unit 6, Stockbridge, GA 30281 and is currently estimated at $502,739, approximately $125 per square foot. 132 Tumble Run Unit 6 is a home located in Henry County with nearby schools including Red Oak Elementary School, Dutchtown Middle School, and Dutchtown High School.
Ownership History
Date
Name
Owned For
Owner Type
Purchase Details
Closed on
Feb 5, 2019
Sold by
Quinones Jorge
Bought by
Hpa Us1 Llc
Current Estimated Value
Purchase Details
Closed on
Jul 20, 2015
Sold by
Wilson Parker Homes Of Fallbrook At Mona
Bought by
Quinones Jorge and Melendez Adriana
Home Financials for this Owner
Home Financials are based on the most recent Mortgage that was taken out on this home.
Original Mortgage
$327,251
Interest Rate
4.04%
Mortgage Type
New Conventional
Purchase Details
Closed on
Aug 25, 2014
Sold by
Faec Fbo Mcre Magnolia Estates
Bought by
Wilson Parker Homes Of Monarch
Purchase Details
Closed on
Feb 8, 2010
Sold by
Redus Atlanta Housing Llc
Bought by
Hart John
Purchase Details
Closed on
Feb 3, 2009
Sold by
Royce Homes-Atlanta Llc
Bought by
Redus Atlanta Housing Llc
Create a Home Valuation Report for This Property
The Home Valuation Report is an in-depth analysis detailing your home's value as well as a comparison with similar homes in the area
Home Values in the Area
Average Home Value in this Area
Purchase History
| Date | Buyer | Sale Price | Title Company |
|---|---|---|---|
| Hpa Us1 Llc | $335,000 | -- | |
| Quinones Jorge | $344,500 | -- | |
| Wilson Parker Homes Of Monarch | $260,000 | -- | |
| Hart John | $185,000 | -- | |
| Redus Atlanta Housing Llc | $387,075 | -- |
Source: Public Records
Mortgage History
| Date | Status | Borrower | Loan Amount |
|---|---|---|---|
| Previous Owner | Quinones Jorge | $327,251 |
Source: Public Records
Tax History Compared to Growth
Tax History
| Year | Tax Paid | Tax Assessment Tax Assessment Total Assessment is a certain percentage of the fair market value that is determined by local assessors to be the total taxable value of land and additions on the property. | Land | Improvement |
|---|---|---|---|---|
| 2025 | $8,176 | $203,280 | $20,000 | $183,280 |
| 2024 | $8,176 | $220,480 | $20,000 | $200,480 |
| 2023 | $8,746 | $212,000 | $18,000 | $194,000 |
| 2022 | $6,521 | $164,160 | $18,000 | $146,160 |
| 2021 | $5,852 | $146,640 | $16,000 | $130,640 |
| 2020 | $5,177 | $128,880 | $12,000 | $116,880 |
| 2019 | $4,621 | $122,880 | $12,000 | $110,880 |
| 2018 | $4,438 | $118,080 | $12,000 | $106,080 |
| 2016 | $5,032 | $133,560 | $12,000 | $121,560 |
| 2015 | $396 | $10,000 | $10,000 | $0 |
| 2014 | $112 | $2,800 | $2,800 | $0 |
Source: Public Records
Map
Nearby Homes
- 540 Anglewood Trace
- 623 Brookwater Dr
- 602 Brookwater Dr
- 520 Monarch Lake Way
- 223 Monarch Village Way
- 266 Monarch Village Way
- 687 Pathwood Ln
- 117 Titan Rd
- 591 Creek Valley Ct
- 3916 Champagne Dr
- 300 Monarch Village Way
- 512 Chaucer Way Unit 1
- 705 Brentwood Pkwy
- 568 Ransom Way
- 213 Sunderland Way Unit 1
- 200 Ernestine Way
- 9055 Kelly Ct
- 1341 Kent Manor Unit 3
- 9056 Chestnut Lake Dr
- 132 Tumble Run
- 132 Tumble Run
- 128 Tumble Run Unit 5
- 128 Tumble Run
- 136 Tumble Run Unit 7
- 136 Tumble Run
- 0 Tumble Run Unit 3204625
- 0 Tumble Run Unit 8692935
- 0 Tumble Run Unit 8813792
- 0 Tumble Run Unit 7466792
- 0 Tumble Run Unit 8494558
- 0 Tumble Run Unit 8549082
- 0 Tumble Run
- 120 Tumble Run Unit 4
- 120 Tumble Run
- 144 Tumble Run Unit 8
- 144 Tumble Run
- 133 Tumble Run Unit 26
- 133 Tumble Run
- 630 Edgecombe Unit 1