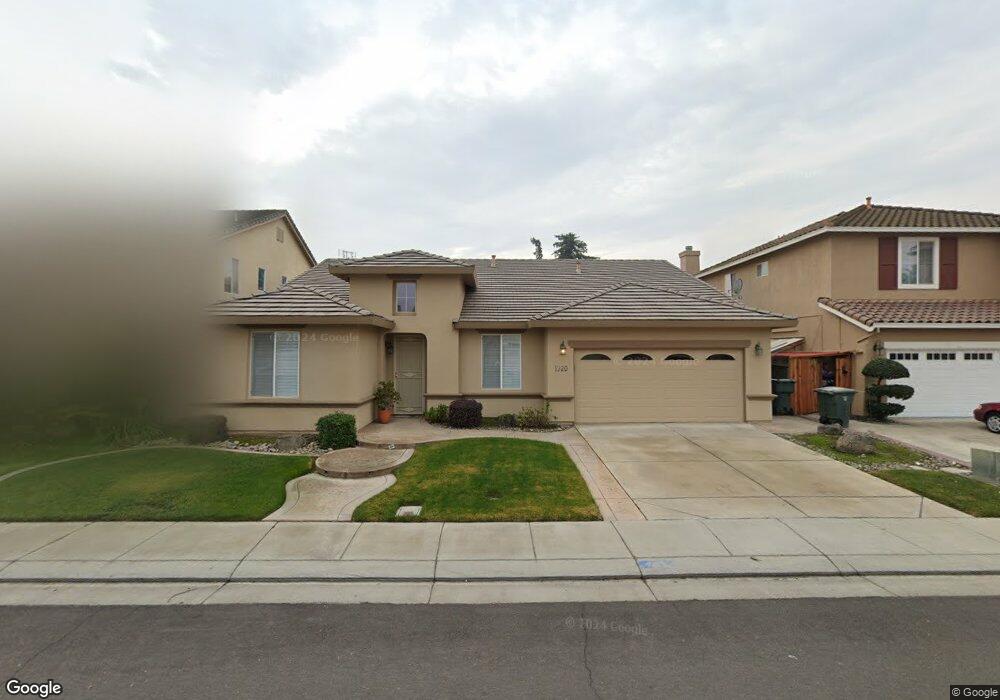
1320 Blakely Ln Modesto, CA 95356
Estimated Value: $612,000 - $755,000
3
Beds
3
Baths
2,567
Sq Ft
$256/Sq Ft
Est. Value
About This Home
This home is located at 1320 Blakely Ln, Modesto, CA 95356 and is currently estimated at $656,111, approximately $255 per square foot. 1320 Blakely Ln is a home located in Stanislaus County with nearby schools including Agnes M. Baptist Elementary School, Prescott Junior High School, and Grace M. Davis High School.
Ownership History
Date
Name
Owned For
Owner Type
Purchase Details
Closed on
Jan 20, 2011
Sold by
Yohannan Louise E
Bought by
Au Yeung Pik Kwan
Current Estimated Value
Home Financials for this Owner
Home Financials are based on the most recent Mortgage that was taken out on this home.
Original Mortgage
$178,500
Outstanding Balance
$5,524
Interest Rate
4.82%
Mortgage Type
Purchase Money Mortgage
Estimated Equity
$650,587
Purchase Details
Closed on
Sep 10, 2004
Sold by
Yohannan Albert and Yohannan Louise E
Bought by
Yohannan Albert Otto and Yohannan Louise E
Purchase Details
Closed on
Jan 19, 2004
Sold by
Modesto Tully Investors Lp
Bought by
Yohannan Albert and Yohannan Louise E
Home Financials for this Owner
Home Financials are based on the most recent Mortgage that was taken out on this home.
Original Mortgage
$202,000
Interest Rate
3.57%
Mortgage Type
Purchase Money Mortgage
Create a Home Valuation Report for This Property
The Home Valuation Report is an in-depth analysis detailing your home's value as well as a comparison with similar homes in the area
Purchase History
| Date | Buyer | Sale Price | Title Company |
|---|---|---|---|
| Au Yeung Pik Kwan | $255,000 | Old Republic Title Company | |
| Yohannan Albert Otto | -- | -- | |
| Yohannan Albert | $361,500 | Chicago Title |
Source: Public Records
Mortgage History
| Date | Status | Borrower | Loan Amount |
|---|---|---|---|
| Open | Au Yeung Pik Kwan | $178,500 | |
| Previous Owner | Yohannan Albert | $202,000 |
Source: Public Records
Tax History
| Year | Tax Paid | Tax Assessment Tax Assessment Total Assessment is a certain percentage of the fair market value that is determined by local assessors to be the total taxable value of land and additions on the property. | Land | Improvement |
|---|---|---|---|---|
| 2025 | $4,270 | $326,688 | $70,458 | $256,230 |
| 2024 | $4,125 | $320,283 | $69,077 | $251,206 |
| 2023 | $4,046 | $314,004 | $67,723 | $246,281 |
| 2022 | $3,938 | $307,848 | $66,396 | $241,452 |
| 2021 | $3,740 | $301,813 | $65,095 | $236,718 |
| 2020 | $3,687 | $298,719 | $64,428 | $234,291 |
| 2019 | $3,639 | $292,863 | $63,165 | $229,698 |
| 2018 | $3,590 | $287,122 | $61,927 | $225,195 |
| 2017 | $3,495 | $281,493 | $60,713 | $220,780 |
| 2016 | $3,455 | $275,974 | $59,523 | $216,451 |
| 2015 | $3,421 | $271,829 | $58,629 | $213,200 |
| 2014 | $3,358 | $266,505 | $57,481 | $209,024 |
Source: Public Records
Map
Nearby Homes
- 4020 Moss Rock Ct
- 3821 Abilene Ct
- 3808 Thornbury Way
- 3808 Longbridge Dr
- 3809 Longbridge Dr
- 3713 Felkirk Way
- 1201 Chateaugay Dr
- Muir Plan at Eve at Founders Point
- Montara Plan at Eve at Founders Point
- Palisade Plan at Eve at Founders Point
- Rockaway Plan at Eve at Founders Point
- 1459 Standiford Ave Unit 68
- 1459 Standiford Ave Unit SP 24
- 4344 Vanguard Dr
- 3700 Tully Rd Unit 57
- 3700 Tully Rd Unit 120
- 1725 Mark Mead Ln
- 3701 Colonial Dr Unit 224
- 3701 Colonial Dr Unit 98
- 3701 Colonial Dr Unit 164
- 1316 Blakely Ln
- 1324 Blakely Ln
- 1312 Blakely Ln
- 1328 Blakely Ln
- 1321 Blakely Ln
- 1317 Blakely Ln
- 1325 Blakely Ln
- 1308 Blakely Ln
- 1400 Blakely Ln
- 1313 Blakely Ln
- 1329 Blakely Ln
- 4001 Rancho Mesa Ct
- 1309 Blakely Ln
- 1401 Jackellen Ln
- 1404 Blakely Ln
- 1405 Jackellen Ln
- 1401 Blakely Ln
- 4000 Rancho Mesa Ct
- 1317 Buccaneer Ct
- 4000 Calistoga Ct
Your Personal Tour Guide
Ask me questions while you tour the home.