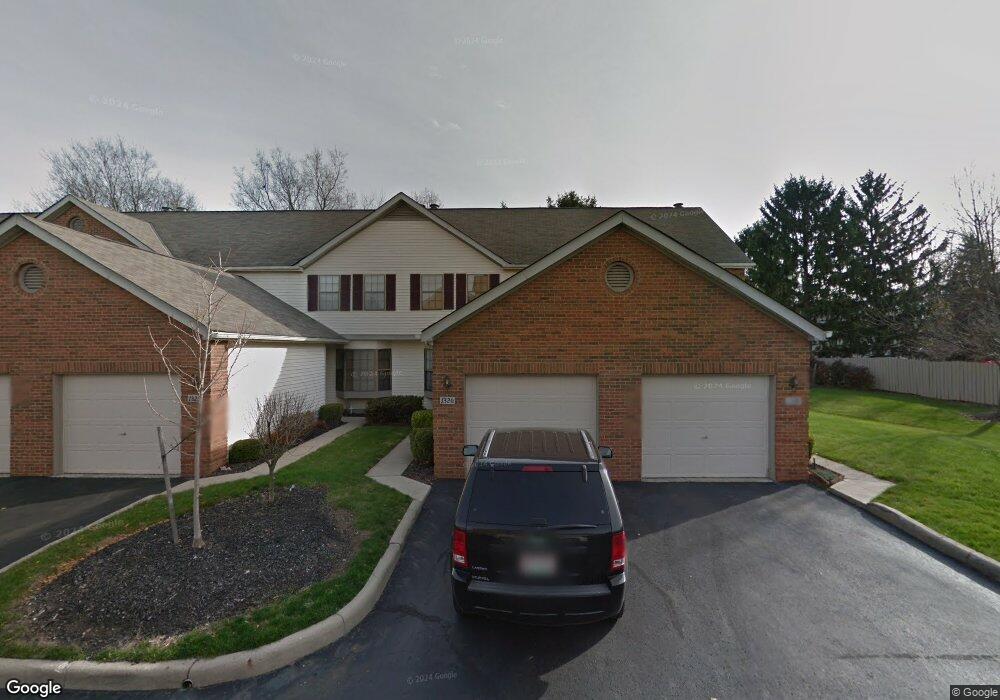
1320 Brookview Cir Unit 1320 Pickerington, OH 43147
Estimated Value: $204,000 - $231,629
2
Beds
3
Baths
1,720
Sq Ft
$130/Sq Ft
Est. Value
About This Home
This home is located at 1320 Brookview Cir Unit 1320, Pickerington, OH 43147 and is currently estimated at $222,907, approximately $129 per square foot. 1320 Brookview Cir Unit 1320 is a home located in Fairfield County with nearby schools including Fairfield Elementary School, Harmon Middle School, and Pickerington Lakeview Junior High School.
Ownership History
Date
Name
Owned For
Owner Type
Purchase Details
Closed on
Jun 11, 2010
Sold by
Secretary Of Housing & Urban Development
Bought by
Siciliano Donna
Current Estimated Value
Purchase Details
Closed on
Jan 5, 2010
Sold by
Burman Eva J
Bought by
Nationwide Advantage Mortgage Company
Purchase Details
Closed on
Dec 4, 2009
Sold by
Nationwide Advantage Mortgage Company
Bought by
Secretary Of Housing & Urban Development
Purchase Details
Closed on
May 31, 2002
Sold by
Howey Ian W
Bought by
Burman Eva J
Purchase Details
Closed on
Jan 26, 1993
Bought by
Howey Lon W
Purchase Details
Closed on
Dec 26, 1991
Bought by
Heath Agency Inc An Ohio Corp
Purchase Details
Closed on
Jul 31, 1991
Bought by
Heath Agency Inc An Ohio Corp
Create a Home Valuation Report for This Property
The Home Valuation Report is an in-depth analysis detailing your home's value as well as a comparison with similar homes in the area
Home Values in the Area
Average Home Value in this Area
Purchase History
| Date | Buyer | Sale Price | Title Company |
|---|---|---|---|
| Siciliano Donna | $72,500 | Valmer Land Title Agency | |
| Nationwide Advantage Mortgage Company | $80,000 | None Available | |
| Secretary Of Housing & Urban Development | -- | None Available | |
| Burman Eva J | $101,000 | -- | |
| Howey Lon W | $69,900 | -- | |
| Heath Agency Inc An Ohio Corp | $4,180,000 | -- | |
| Heath Agency Inc An Ohio Corp | $4,869,700 | -- |
Source: Public Records
Mortgage History
| Date | Status | Borrower | Loan Amount |
|---|---|---|---|
| Closed | Burman Eva J | -- |
Source: Public Records
Tax History Compared to Growth
Tax History
| Year | Tax Paid | Tax Assessment Tax Assessment Total Assessment is a certain percentage of the fair market value that is determined by local assessors to be the total taxable value of land and additions on the property. | Land | Improvement |
|---|---|---|---|---|
| 2024 | $6,713 | $54,530 | $7,000 | $47,530 |
| 2023 | $2,634 | $54,530 | $7,000 | $47,530 |
| 2022 | $2,642 | $54,530 | $7,000 | $47,530 |
| 2021 | $2,433 | $42,740 | $7,000 | $35,740 |
| 2020 | $2,460 | $42,740 | $7,000 | $35,740 |
| 2019 | $2,476 | $42,740 | $7,000 | $35,740 |
| 2018 | $2,356 | $35,510 | $7,000 | $28,510 |
| 2017 | $2,363 | $35,490 | $7,000 | $28,490 |
| 2016 | $2,352 | $35,490 | $7,000 | $28,490 |
| 2015 | $2,324 | $33,150 | $7,000 | $26,150 |
| 2014 | $2,297 | $33,150 | $7,000 | $26,150 |
| 2013 | $2,297 | $33,150 | $7,000 | $26,150 |
Source: Public Records
Map
Nearby Homes
- 1324 Brookview Cir
- 1259 Somerset Way Unit 1259
- 1361 Eastwick Way
- 12517 Heritage Way NW
- 1179 Cambridge Way Unit 1179
- 12278 Butterfield Dr
- 12052 Peppermill Ln
- 0 Windmiller Dr
- 9685 Grandview Ave
- 307 Belstone St Unit 307
- 12036 Steeplechase Ave NW
- 12550 Harmon Rd
- 12316 Thoroughbred Dr
- 11608 Meadow Ave
- 919 Washington St
- 692 Hill Rd N
- 12394 Bentwood Farms Dr
- 1035 Milford Dr
- 12008 Sheldrake Ct
- 250 Sterndale Dr
- 1318 Brookview Cir Unit 1318
- 1322 Brookview Cir
- 1326 Brookview Cir
- 1328 Brookview Cir
- 830 Refugee Rd
- 1212 Brookview Cir
- 1330 Brookview Cir
- 1214 Brookview Cir Unit 1214
- 1332 Brookview Cir Unit 1332
- 12113 Woodstock Ave
- 1216 Brookview Cir
- 12125 Woodstock Ave
- 1218 Brookview Cir
- 1327 Brookview Cir
- 1329 Brookview Cir Unit 1329
- 1334 Brookview Cir Unit 1334
- 1220 Brookview Cir Unit 1220
- 1331 Brookview Cir Unit 1331
- 12095 Woodstock Ave
- 1336 Brookview Cir