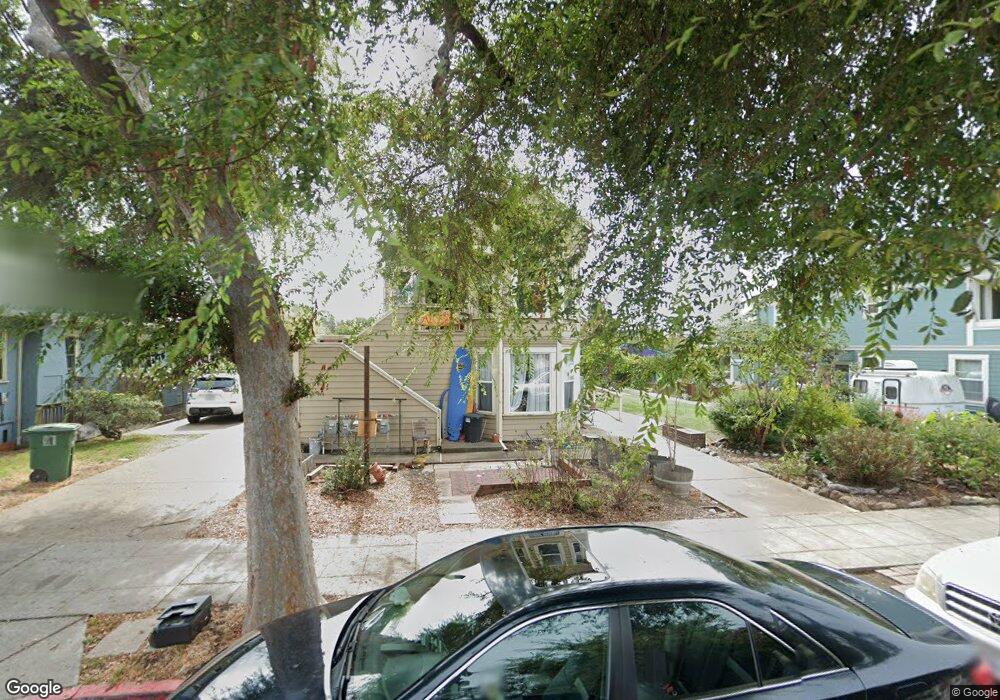
1320 Haskell St Unit 1322B Berkeley, CA 94702
West Berkeley NeighborhoodEstimated Value: $603,000 - $874,000
1
Bed
1
Bath
659
Sq Ft
$1,153/Sq Ft
Est. Value
About This Home
This home is located at 1320 Haskell St Unit 1322B, Berkeley, CA 94702 and is currently estimated at $759,713, approximately $1,152 per square foot. 1320 Haskell St Unit 1322B is a home located in Alameda County with nearby schools including Malcolm X Elementary School, Washington Elementary School, and Oxford Elementary School.
Ownership History
Date
Name
Owned For
Owner Type
Purchase Details
Closed on
Mar 21, 2007
Sold by
West Joseph A and West Tyrah S
Bought by
Dann Laura
Current Estimated Value
Home Financials for this Owner
Home Financials are based on the most recent Mortgage that was taken out on this home.
Original Mortgage
$143,425
Outstanding Balance
$86,956
Interest Rate
6.29%
Mortgage Type
Purchase Money Mortgage
Estimated Equity
$672,757
Purchase Details
Closed on
Dec 8, 2003
Sold by
The Northern California Land Trust
Bought by
West Joseph A and West Tyrah S
Home Financials for this Owner
Home Financials are based on the most recent Mortgage that was taken out on this home.
Original Mortgage
$137,740
Interest Rate
5.57%
Mortgage Type
Purchase Money Mortgage
Create a Home Valuation Report for This Property
The Home Valuation Report is an in-depth analysis detailing your home's value as well as a comparison with similar homes in the area
Home Values in the Area
Average Home Value in this Area
Purchase History
| Date | Buyer | Sale Price | Title Company |
|---|---|---|---|
| Dann Laura | $153,500 | Placer Title Company | |
| West Joseph A | $142,000 | Old Republic Title Company |
Source: Public Records
Mortgage History
| Date | Status | Borrower | Loan Amount |
|---|---|---|---|
| Open | Dann Laura | $143,425 | |
| Previous Owner | West Joseph A | $137,740 |
Source: Public Records
Tax History
| Year | Tax Paid | Tax Assessment Tax Assessment Total Assessment is a certain percentage of the fair market value that is determined by local assessors to be the total taxable value of land and additions on the property. | Land | Improvement |
|---|---|---|---|---|
| 2025 | $3,632 | $198,640 | $61,625 | $144,015 |
| 2024 | $3,632 | $194,609 | $60,417 | $141,192 |
| 2023 | $3,547 | $197,656 | $59,232 | $138,424 |
| 2022 | $3,470 | $186,782 | $58,071 | $135,711 |
| 2021 | $3,464 | $182,983 | $56,933 | $133,050 |
| 2020 | $3,271 | $188,035 | $56,349 | $131,686 |
| 2019 | $3,129 | $184,350 | $55,245 | $129,105 |
| 2018 | $3,067 | $180,736 | $54,162 | $126,574 |
| 2017 | $2,932 | $177,193 | $53,100 | $124,093 |
| 2016 | $2,820 | $173,719 | $52,059 | $121,660 |
| 2015 | $2,780 | $171,112 | $51,278 | $119,834 |
| 2014 | $2,755 | $167,760 | $50,273 | $117,487 |
Source: Public Records
Map
Nearby Homes
- 3032 Mabel St
- 1314 Ashby Ave
- 1080 67th St
- 1237 Ashby Ave
- 3101 Sacramento St
- 1507 Prince St
- 2922 Stanton St
- 6500 San Pablo Ave
- 3224 Sacramento St
- 6501 San Pablo Ave Unit 410
- 6465 San Pablo Ave Unit 306
- 6465 San Pablo Ave Unit 203
- 3110 California St
- 3114 California St
- 3138 California St
- 1126 Ocean Ave
- 3214 California St
- 1535 Julia St
- 1164 Ocean Ave
- 968 62nd St
- 1320 Haskell St Unit 1320
- 1320 Haskell St Unit 1322C
- 1320 Haskell St Unit 1322A
- 1320 Haskell St
- 1324 Haskell St
- 1314 Haskell St Unit C
- 1314 Haskell St Unit B
- 1314 Haskell St Unit A
- 1328 Haskell St
- 1312 Haskell St
- 1330 Haskell St
- 1321 67th St
- 1310 Haskell St
- 1317 67th St
- 1323 67th St
- 1315 67th St
- 1311 67th St
- 1327 67th St
- 1340 Haskell St
- 1309 67th St
Your Personal Tour Guide
Ask me questions while you tour the home.