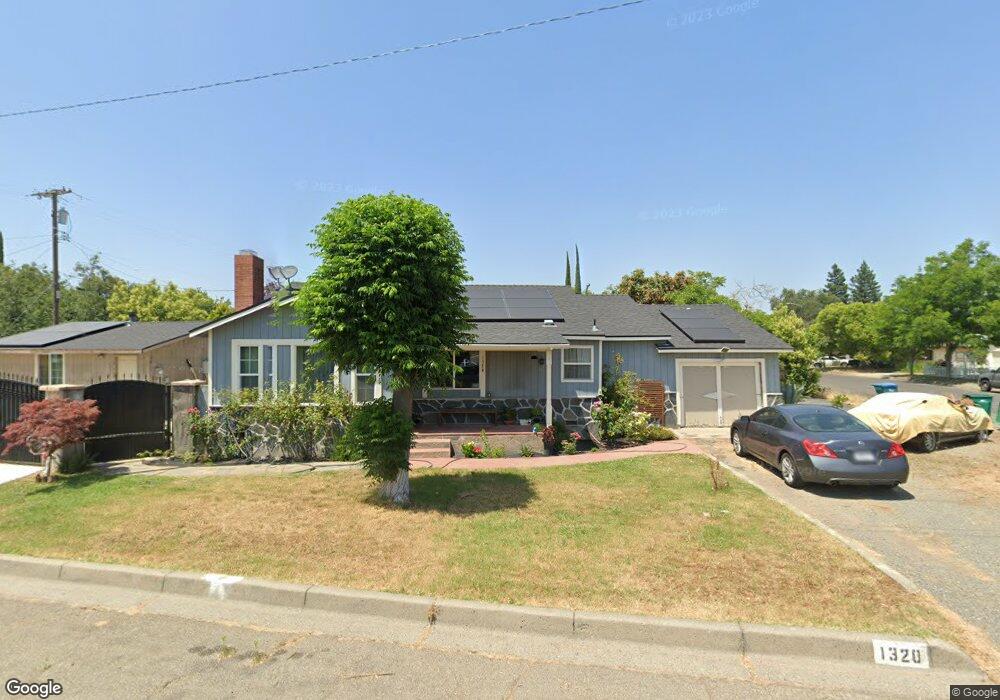
1320 Locust St Gridley, CA 95948
Estimated Value: $197,000 - $321,000
3
Beds
1
Bath
1,193
Sq Ft
$230/Sq Ft
Est. Value
About This Home
This home is located at 1320 Locust St, Gridley, CA 95948 and is currently estimated at $274,965, approximately $230 per square foot. 1320 Locust St is a home located in Butte County with nearby schools including McKinley Elementary School, Wilson Elementary School, and Sycamore Middle School.
Ownership History
Date
Name
Owned For
Owner Type
Purchase Details
Closed on
Jul 28, 2020
Sold by
Gallo Erik S
Bought by
Garcia Sandra Lies Aguilera
Current Estimated Value
Purchase Details
Closed on
Sep 30, 2011
Sold by
Ventioner Timothy A
Bought by
Gallo Erik S and Aguilera Sandra
Purchase Details
Closed on
Mar 3, 1997
Sold by
Ventioner Neil R and Ventioner Helen
Bought by
Ventioner Timothy A
Create a Home Valuation Report for This Property
The Home Valuation Report is an in-depth analysis detailing your home's value as well as a comparison with similar homes in the area
Home Values in the Area
Average Home Value in this Area
Purchase History
| Date | Buyer | Sale Price | Title Company |
|---|---|---|---|
| Garcia Sandra Lies Aguilera | -- | None Available | |
| Gallo Erik S | $19,500 | Bidwell Title & Escrow Co | |
| Ventioner Timothy A | -- | Bidwell Title |
Source: Public Records
Tax History
| Year | Tax Paid | Tax Assessment Tax Assessment Total Assessment is a certain percentage of the fair market value that is determined by local assessors to be the total taxable value of land and additions on the property. | Land | Improvement |
|---|---|---|---|---|
| 2025 | $1,042 | $98,795 | $31,394 | $67,401 |
| 2024 | $1,042 | $96,859 | $30,779 | $66,080 |
| 2023 | $1,035 | $94,961 | $30,176 | $64,785 |
| 2022 | $969 | $93,100 | $29,585 | $63,515 |
| 2021 | $944 | $91,275 | $29,005 | $62,270 |
| 2020 | $941 | $90,340 | $28,708 | $61,632 |
| 2019 | $922 | $88,570 | $28,146 | $60,424 |
| 2018 | $906 | $86,835 | $27,595 | $59,240 |
| 2017 | $887 | $85,133 | $27,054 | $58,079 |
| 2016 | $852 | $83,465 | $26,524 | $56,941 |
| 2015 | $907 | $82,212 | $26,126 | $56,086 |
| 2014 | $892 | $80,603 | $25,615 | $54,988 |
Source: Public Records
Map
Nearby Homes
Your Personal Tour Guide
Ask me questions while you tour the home.