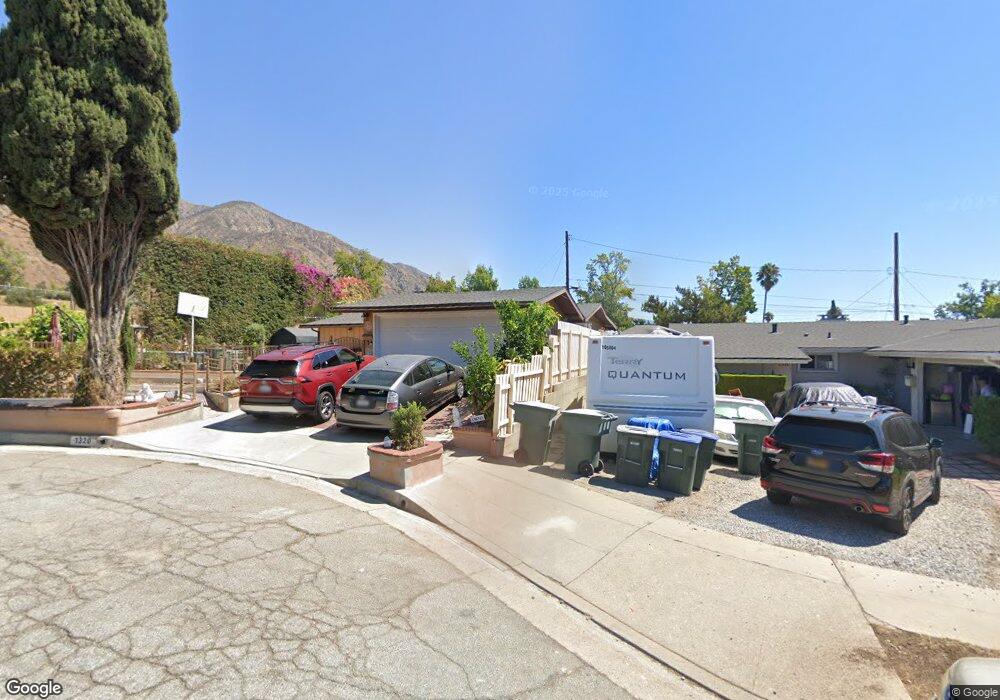
1320 Medford Rd Pasadena, CA 91107
Upper Hastings Ranch NeighborhoodEstimated Value: $1,260,000 - $1,523,000
3
Beds
2
Baths
1,630
Sq Ft
$846/Sq Ft
Est. Value
About This Home
This home is located at 1320 Medford Rd, Pasadena, CA 91107 and is currently estimated at $1,378,468, approximately $845 per square foot. 1320 Medford Rd is a home located in Los Angeles County with nearby schools including Don Benito Fundamental, Pasadena High School, and Bethany Christian School.
Ownership History
Date
Name
Owned For
Owner Type
Purchase Details
Closed on
Jul 2, 1999
Sold by
Henning Craig M and Henning Roxanne L
Bought by
Kohner Eric
Current Estimated Value
Home Financials for this Owner
Home Financials are based on the most recent Mortgage that was taken out on this home.
Original Mortgage
$252,000
Outstanding Balance
$71,034
Interest Rate
7.64%
Estimated Equity
$1,307,434
Purchase Details
Closed on
Aug 16, 1996
Sold by
First Federal Bank Of California
Bought by
Henning Craig M and Henning Roxanne L
Home Financials for this Owner
Home Financials are based on the most recent Mortgage that was taken out on this home.
Original Mortgage
$208,500
Interest Rate
8.2%
Mortgage Type
Seller Take Back
Purchase Details
Closed on
Apr 24, 1996
Sold by
Caceres Raul and Caceres Elvira
Bought by
First Federal Bank Of California
Create a Home Valuation Report for This Property
The Home Valuation Report is an in-depth analysis detailing your home's value as well as a comparison with similar homes in the area
Home Values in the Area
Average Home Value in this Area
Purchase History
| Date | Buyer | Sale Price | Title Company |
|---|---|---|---|
| Kohner Eric | $280,000 | Chicago Title Co | |
| Henning Craig M | $220,000 | Southland Title Corporation | |
| First Federal Bank Of California | $229,213 | American Title |
Source: Public Records
Mortgage History
| Date | Status | Borrower | Loan Amount |
|---|---|---|---|
| Open | Kohner Eric | $252,000 | |
| Previous Owner | Henning Craig M | $208,500 |
Source: Public Records
Tax History
| Year | Tax Paid | Tax Assessment Tax Assessment Total Assessment is a certain percentage of the fair market value that is determined by local assessors to be the total taxable value of land and additions on the property. | Land | Improvement |
|---|---|---|---|---|
| 2025 | $5,124 | $430,331 | $344,273 | $86,058 |
| 2024 | $5,124 | $421,894 | $337,523 | $84,371 |
| 2023 | $5,079 | $413,622 | $330,905 | $82,717 |
| 2022 | $4,909 | $405,513 | $324,417 | $81,096 |
| 2021 | $4,711 | $397,562 | $318,056 | $79,506 |
| 2019 | $4,542 | $385,772 | $308,623 | $77,149 |
| 2018 | $4,494 | $378,209 | $302,572 | $75,637 |
| 2016 | $4,331 | $363,524 | $290,824 | $72,700 |
| 2015 | $4,282 | $358,064 | $286,456 | $71,608 |
| 2014 | $4,199 | $351,051 | $280,845 | $70,206 |
Source: Public Records
Map
Nearby Homes
- 1265 Hastings Ranch Dr
- 1420 Riviera Dr
- 1220 Tropical Ave
- 526 N Michillinda Ave
- 661 W Alegria Ave
- 3880 Startouch Dr
- 1010 Pepperhill Rd
- 0 Ranch Top Rd
- 589 W Grandview Ave
- 3984 Park Vista Cir
- 985 N Michillinda Ave Unit 207
- 1624 Hastings Heights Ln
- 230 N Sunnyside Ave
- 3350 Calvert Rd
- 3263 New York Dr
- 3577 Shaw Ranch Rd
- 660 Chaparral Rd
- 217 N Lima St
- 3325 Primavera St
- 3880 Shadow Grove Rd
- 1310 Medford Rd
- 1325 Valley View Ave
- 1300 Medford Rd
- 1315 Valleyview Ave
- 1315 Valley View Ave
- 1305 Valley View Ave
- 1290 Medford Rd
- 1315 Medford Rd
- 1295 Valley View Ave
- 1305 Medford Rd
- 1280 Medford Rd
- 1295 Medford Rd
- 1285 Valley View Ave
- 1270 Medford Rd
- 1320 Valley View Ave
- 1285 Medford Rd
- 1310 Valley View Ave
- 1330 Valley View Ave
- 1310 Hastings Ranch Dr
- 1275 Valley View Ave
Your Personal Tour Guide
Ask me questions while you tour the home.