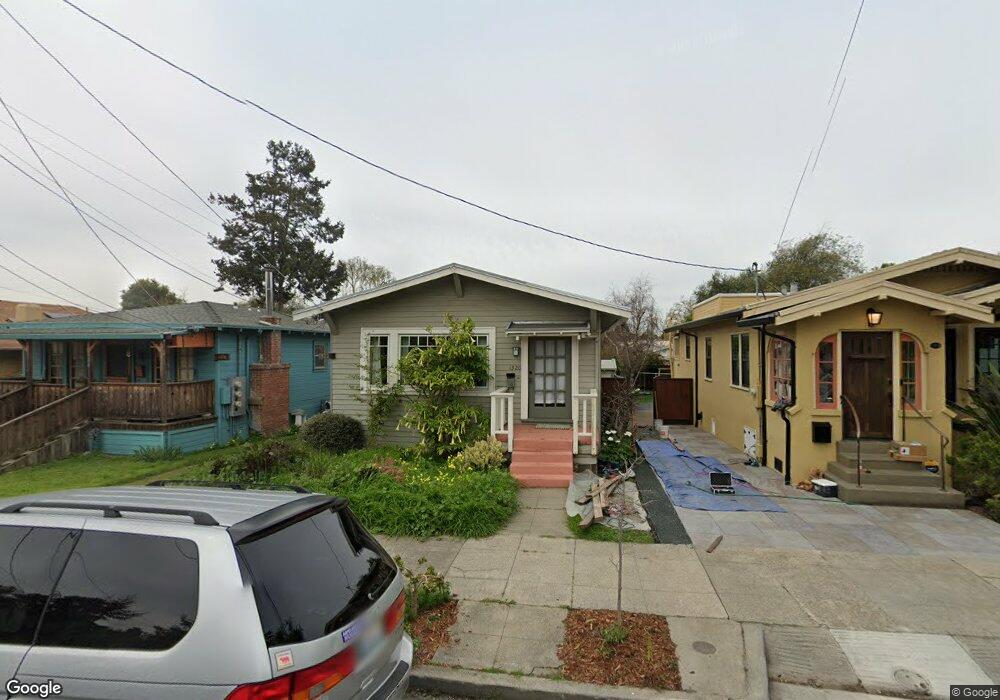
1320 Ordway St Unit B Berkeley, CA 94702
West Berkeley NeighborhoodEstimated Value: $683,000 - $1,120,000
Studio
1
Bath
468
Sq Ft
$1,879/Sq Ft
Est. Value
About This Home
This home is located at 1320 Ordway St Unit B, Berkeley, CA 94702 and is currently estimated at $879,390, approximately $1,879 per square foot. 1320 Ordway St Unit B is a home located in Alameda County with nearby schools including Ruth Acty Elementary, Thousand Oaks Elementary School, and Berkeley Arts Magnet at Whittier School.
Ownership History
Date
Name
Owned For
Owner Type
Purchase Details
Closed on
Jan 19, 2012
Sold by
Miller Elaine Alice
Bought by
Miller Elaine Alice
Current Estimated Value
Home Financials for this Owner
Home Financials are based on the most recent Mortgage that was taken out on this home.
Original Mortgage
$170,000
Outstanding Balance
$115,988
Interest Rate
3.88%
Mortgage Type
New Conventional
Estimated Equity
$763,402
Purchase Details
Closed on
Apr 7, 2009
Sold by
Miller Elaine Alice
Bought by
Miller Elaine Alice
Purchase Details
Closed on
Dec 27, 2000
Sold by
Bergman Eugene A
Bought by
Miller Elaine Alice
Home Financials for this Owner
Home Financials are based on the most recent Mortgage that was taken out on this home.
Original Mortgage
$174,400
Interest Rate
7.71%
Mortgage Type
Seller Take Back
Purchase Details
Closed on
Jan 21, 1998
Sold by
Bergman Eugene A and Bergman Deena J
Bought by
Bergman Eugene A
Create a Home Valuation Report for This Property
The Home Valuation Report is an in-depth analysis detailing your home's value as well as a comparison with similar homes in the area
Home Values in the Area
Average Home Value in this Area
Purchase History
| Date | Buyer | Sale Price | Title Company |
|---|---|---|---|
| Miller Elaine Alice | -- | Fidelity National Title Co | |
| Miller Elaine Alice | -- | None Available | |
| Miller Elaine Alice | $218,000 | Old Republic Title Company | |
| Bergman Eugene A | -- | Old Republic Title Company |
Source: Public Records
Mortgage History
| Date | Status | Borrower | Loan Amount |
|---|---|---|---|
| Open | Miller Elaine Alice | $170,000 | |
| Closed | Miller Elaine Alice | $174,400 |
Source: Public Records
Tax History
| Year | Tax Paid | Tax Assessment Tax Assessment Total Assessment is a certain percentage of the fair market value that is determined by local assessors to be the total taxable value of land and additions on the property. | Land | Improvement |
|---|---|---|---|---|
| 2025 | $4,978 | $321,466 | $98,540 | $229,926 |
| 2024 | $4,978 | $315,027 | $96,608 | $225,419 |
| 2023 | $4,872 | $315,713 | $94,714 | $220,999 |
| 2022 | $4,784 | $302,524 | $92,857 | $216,667 |
| 2021 | $4,791 | $296,455 | $91,036 | $212,419 |
| 2020 | $4,560 | $300,344 | $90,103 | $210,241 |
| 2019 | $4,403 | $294,456 | $88,337 | $206,119 |
| 2018 | $4,329 | $288,684 | $86,605 | $202,079 |
| 2017 | $4,155 | $283,024 | $84,907 | $198,117 |
| 2016 | $4,029 | $277,476 | $83,243 | $194,233 |
| 2015 | $3,976 | $273,310 | $81,993 | $191,317 |
| 2014 | $3,960 | $267,958 | $80,387 | $187,571 |
Source: Public Records
Map
Nearby Homes
- 1368 Rose St
- 1400 Santa fe Ave
- 1516 Belvedere Ave
- 1529 Ada St
- 1120 Curtis St
- 1509 Francis St
- 1564 Sacramento St
- 1127 Key Route Blvd
- 1207 Cornell Ave
- 1234 Stannage Ave
- 1322 Virginia St
- 1114 Talbot Ave
- 1036 Ramona Ave
- 1207 Francisco St
- 1207 Francisco St Unit 2
- 1213 San Pablo Ave
- 1728 Curtis St
- 1436 Delaware St
- 1411 Hearst Ave Unit 2
- 1813 Sacramento St
- 1320 Ordway St Unit D
- 1320 Ordway St Unit C
- 1320 Ordway St Unit A
- 1326 Ordway St
- 1318 Ordway St
- 1332 Ordway St
- 1316 Ordway St
- 1334 Ordway St
- 1314 Ordway St
- 1336 Ordway St
- 1325 Peralta Ave
- 1319 Peralta Ave
- 1321 Peralta Ave
- 1327 Peralta Ave
- 1312 Ordway St
- 1338 Ordway St
- 1317 Peralta Ave
- 1329 Peralta Ave
- 1325 Ordway St
- 1321 Ordway St
Your Personal Tour Guide
Ask me questions while you tour the home.