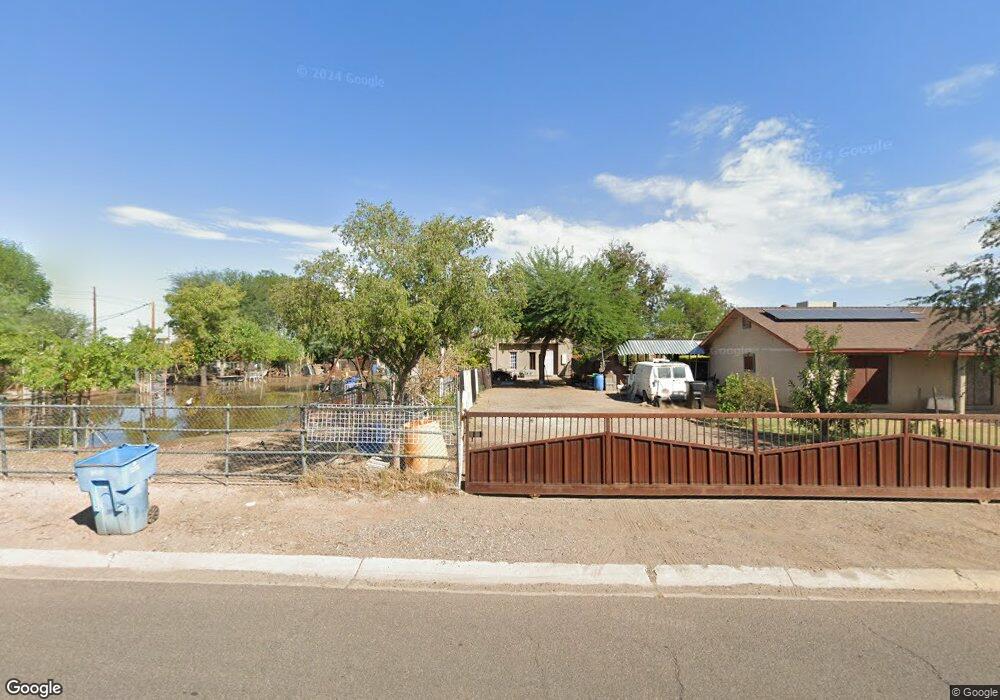
1320 W Tamarisk St Phoenix, AZ 85041
South Mountain NeighborhoodEstimated Value: $585,745 - $781,000
--
Bed
--
Bath
2,775
Sq Ft
$241/Sq Ft
Est. Value
About This Home
This home is located at 1320 W Tamarisk St, Phoenix, AZ 85041 and is currently estimated at $669,686, approximately $241 per square foot. 1320 W Tamarisk St is a home with nearby schools including John R Davis School, Cesar Chavez High School, and Phoenix Coding Academy.
Ownership History
Date
Name
Owned For
Owner Type
Purchase Details
Closed on
Jan 25, 2008
Sold by
Arellano Manuel C
Bought by
Arellano Manuel M and Arellano Manuel C
Current Estimated Value
Purchase Details
Closed on
Oct 12, 2005
Sold by
Melendez Tomasa
Bought by
Arellano Manuel
Home Financials for this Owner
Home Financials are based on the most recent Mortgage that was taken out on this home.
Original Mortgage
$278,000
Outstanding Balance
$169,818
Interest Rate
8.09%
Mortgage Type
Purchase Money Mortgage
Estimated Equity
$499,868
Purchase Details
Closed on
Aug 3, 2000
Sold by
Aposhian Jay J and Aposhian Ada A
Bought by
Arellano Manuel and Melendez Tomasa
Home Financials for this Owner
Home Financials are based on the most recent Mortgage that was taken out on this home.
Original Mortgage
$162,000
Interest Rate
9.74%
Mortgage Type
Commercial
Purchase Details
Closed on
Apr 9, 1998
Sold by
Johnson Kent A and Johnson Jennal L
Bought by
Renteria Jose Luis and Renteria Maria Santos E
Create a Home Valuation Report for This Property
The Home Valuation Report is an in-depth analysis detailing your home's value as well as a comparison with similar homes in the area
Home Values in the Area
Average Home Value in this Area
Purchase History
| Date | Buyer | Sale Price | Title Company |
|---|---|---|---|
| Arellano Manuel M | -- | None Available | |
| Arellano Manuel | -- | Equity Title Agency Inc | |
| Arellano Manuel | $180,000 | Stewart Title & Trust | |
| Renteria Jose Luis | -- | Chicago Title Insurance Co |
Source: Public Records
Mortgage History
| Date | Status | Borrower | Loan Amount |
|---|---|---|---|
| Open | Arellano Manuel | $278,000 | |
| Closed | Arellano Manuel | $162,000 | |
| Closed | Arellano Manuel | $9,000 |
Source: Public Records
Tax History Compared to Growth
Tax History
| Year | Tax Paid | Tax Assessment Tax Assessment Total Assessment is a certain percentage of the fair market value that is determined by local assessors to be the total taxable value of land and additions on the property. | Land | Improvement |
|---|---|---|---|---|
| 2025 | $4,096 | $31,099 | -- | -- |
| 2024 | $3,971 | $29,618 | -- | -- |
| 2023 | $3,971 | $48,380 | $9,670 | $38,710 |
| 2022 | $3,889 | $38,600 | $7,720 | $30,880 |
| 2021 | $4,010 | $37,080 | $7,410 | $29,670 |
| 2020 | $1,122 | $20,160 | $4,030 | $16,130 |
| 2019 | $1,084 | $17,230 | $3,440 | $13,790 |
| 2018 | $1,054 | $12,670 | $2,530 | $10,140 |
| 2017 | $992 | $11,260 | $2,250 | $9,010 |
| 2016 | $942 | $10,000 | $2,000 | $8,000 |
| 2015 | $880 | $7,510 | $1,500 | $6,010 |
Source: Public Records
Map
Nearby Homes
- 945 W Corona Ave
- 920 W Tamarisk St
- 1548 W Roeser Rd
- 643 W Wier Ave
- 5309 S 16th Dr
- 8503 S 9th Dr Unit 17
- 1312 W Sunland Ave
- 5519 S 11th Ave
- 515 W Romley Ave
- 5523 S 11th Ave
- 4602 S 19th Ave
- 4602 S 19th Ave
- 1550 W Southern Ave Unit 20
- 250 W Wier Ave
- 1617 W Pecan Rd
- 313 W Jones Ave
- 5408 S 19th Ave
- 2024 W Roeser Rd
- 126 W Pueblo Ave
- 1702 W Hidalgo Ave
- 1340 W Tamarisk St
- 1323 W Corona Ave
- 1317 W Tamarisk St
- 1333 W Corona Ave
- 1302 W Tamarisk St
- 1311 W Corona Ave
- 4627 S 15th Ave
- 1335 W Tamarisk St
- 4617 S 15th Ave
- 1301 W Tamarisk St
- 1142 W Tamarisk St
- 4705 S 15th Ave
- 4615 S 15th Ave Unit 112
- 4615 S 15th Ave
- 1147 W Corona Ave
- 1137 W Tamarisk St
- 1137 W Corona Ave
- 1134 W Tamarisk St
- 4711 S 15th Ave
- 1336 W Corona Ave