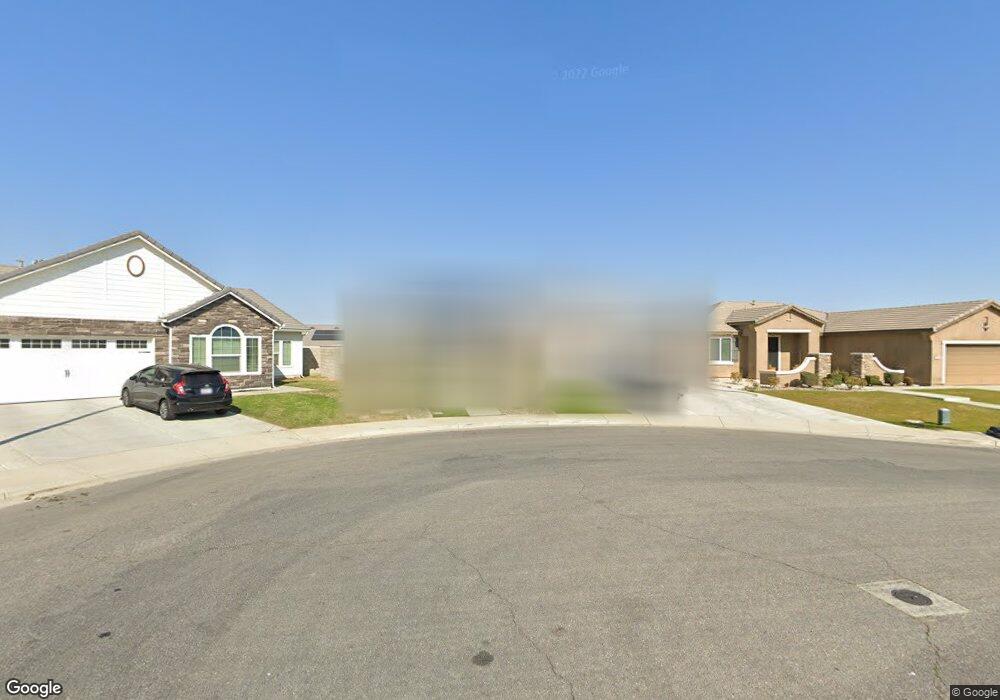
13208 Morning Song St Bakersfield, CA 93314
Estimated Value: $447,000 - $470,000
4
Beds
3
Baths
1,945
Sq Ft
$236/Sq Ft
Est. Value
About This Home
This home is located at 13208 Morning Song St, Bakersfield, CA 93314 and is currently estimated at $458,248, approximately $235 per square foot. 13208 Morning Song St is a home with nearby schools including Patriot Elementary School, Freedom Middle School, and Frontier High School.
Ownership History
Date
Name
Owned For
Owner Type
Purchase Details
Closed on
Feb 1, 2021
Sold by
Kuhn Billy and Bahnsen Kuhn Jennifer
Bought by
Kuhn Billy and Bahnsen Kuhn Jennifer
Current Estimated Value
Home Financials for this Owner
Home Financials are based on the most recent Mortgage that was taken out on this home.
Original Mortgage
$257,481
Outstanding Balance
$231,657
Interest Rate
3.05%
Mortgage Type
VA
Estimated Equity
$226,591
Purchase Details
Closed on
Apr 28, 2015
Sold by
Kuhn Bill and Bahnsen Kuhn Jennifer
Bought by
Kuhn Bill and Bahnsen Kuhn Jennifer
Home Financials for this Owner
Home Financials are based on the most recent Mortgage that was taken out on this home.
Original Mortgage
$274,778
Interest Rate
3.67%
Mortgage Type
VA
Purchase Details
Closed on
Jan 6, 2012
Sold by
Lennar Homes Of California Inc
Bought by
Kuhn Bill and Bahnsen Jennifer
Home Financials for this Owner
Home Financials are based on the most recent Mortgage that was taken out on this home.
Original Mortgage
$242,299
Interest Rate
3.96%
Mortgage Type
VA
Create a Home Valuation Report for This Property
The Home Valuation Report is an in-depth analysis detailing your home's value as well as a comparison with similar homes in the area
Home Values in the Area
Average Home Value in this Area
Purchase History
| Date | Buyer | Sale Price | Title Company |
|---|---|---|---|
| Kuhn Billy | -- | Pacific Coast Title Company | |
| Kuhn Bill | -- | American Coast Title | |
| Kuhn Bill | $237,500 | North American Title Company |
Source: Public Records
Mortgage History
| Date | Status | Borrower | Loan Amount |
|---|---|---|---|
| Open | Kuhn Billy | $257,481 | |
| Closed | Kuhn Bill | $274,778 | |
| Closed | Kuhn Bill | $242,299 |
Source: Public Records
Tax History Compared to Growth
Tax History
| Year | Tax Paid | Tax Assessment Tax Assessment Total Assessment is a certain percentage of the fair market value that is determined by local assessors to be the total taxable value of land and additions on the property. | Land | Improvement |
|---|---|---|---|---|
| 2025 | $5,088 | $297,672 | $62,796 | $234,876 |
| 2024 | $4,954 | $291,836 | $61,565 | $230,271 |
| 2023 | $4,954 | $286,114 | $60,358 | $225,756 |
| 2022 | $4,872 | $280,505 | $59,175 | $221,330 |
| 2021 | $4,733 | $275,006 | $58,015 | $216,991 |
| 2020 | $4,670 | $272,188 | $57,421 | $214,767 |
| 2019 | $4,598 | $272,188 | $57,421 | $214,767 |
| 2018 | $4,500 | $261,621 | $55,193 | $206,428 |
| 2017 | $4,442 | $256,492 | $54,111 | $202,381 |
| 2016 | $4,230 | $251,463 | $53,050 | $198,413 |
| 2015 | $4,184 | $247,687 | $52,254 | $195,433 |
| 2014 | $4,128 | $242,836 | $51,231 | $191,605 |
Source: Public Records
Map
Nearby Homes
- 13432 Ridgeway Meadows Dr
- 13416 Ridgeway Meadows Dr
- 13500 Sunlight Star St
- 13100 Yampa River St Unit 3
- 5308 Elk Run Ct
- 13118 Ridgeway Meadows Dr
- 6002 Dartmoor Wood Ave
- 6006 Dartmoor Wood Ave
- 6110 Ozark Mountain Dr
- 13404 Cheyenne Mountain Dr
- 13404 Scafell Pike St
- 13421 Cheyenne Mountain Dr
- 6010 Inverwood Dr
- 12809 Trafalgar Square Dr
- 12709 Montbatten Place
- Oriole Plan at Laurelwood
- Lark Plan at Laurelwood
- Sparrow Plan at Laurelwood
- Wren Plan at Laurelwood
- 12600 Hawaii Ln
- 13204 Morning Song St
- 13212 Morning Song St
- 13215 Sunlight Star St
- 13200 Morning Song St
- 13211 Sunlight Star St
- 13219 Sunlight Star St
- 13203 Sunlight Star St
- 13223 Sunlight Star St
- 13209 Morning Song St
- 13205 Morning Song St
- 13301 Sunlight Star St
- 13213 Morning Song St
- 13201 Morning Song St
- 13110 Morning Song St
- 13302 Night Star Ln
- 13305 Sunlight Star St
- 13115 Morning Song St
- 13113 Sunlight Star St
- 13306 Night Star Ln
- 13210 Sunlight Star St