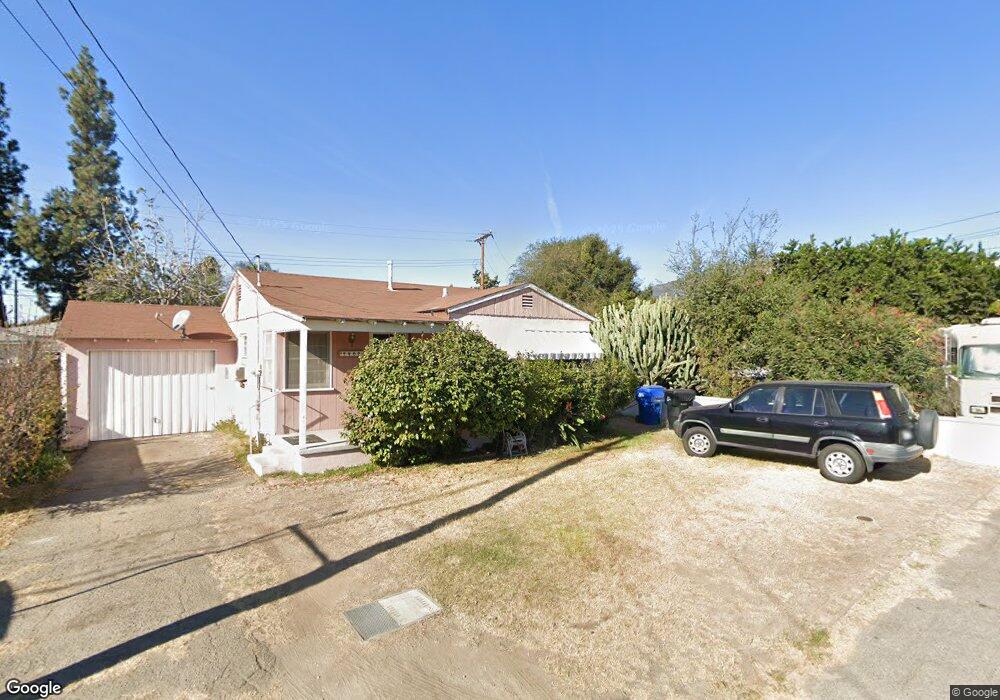
1321 Contented Ln Monrovia, CA 91016
Estimated Value: $695,479 - $986,000
1
Bed
1
Bath
633
Sq Ft
$1,272/Sq Ft
Est. Value
About This Home
This home is located at 1321 Contented Ln, Monrovia, CA 91016 and is currently estimated at $805,120, approximately $1,271 per square foot. 1321 Contented Ln is a home located in Los Angeles County with nearby schools including Wild Rose Elementary School, Santa Fe Computer Science Magnet, and Monrovia High School.
Ownership History
Date
Name
Owned For
Owner Type
Purchase Details
Closed on
Dec 30, 2019
Sold by
Wells Nicholas and Wells Nicholas Noviello
Bought by
Wells Nicholas and Nicholas Wells Revocable Trust
Current Estimated Value
Purchase Details
Closed on
Mar 15, 2007
Sold by
Noviello Katy
Bought by
Wells Nicholas Noviello
Home Financials for this Owner
Home Financials are based on the most recent Mortgage that was taken out on this home.
Original Mortgage
$92,000
Interest Rate
6.2%
Mortgage Type
New Conventional
Purchase Details
Closed on
Jul 22, 1997
Sold by
Buchanan Doris T
Bought by
Noviello Nicholas and Noviello Katy
Home Financials for this Owner
Home Financials are based on the most recent Mortgage that was taken out on this home.
Original Mortgage
$87,000
Interest Rate
7.45%
Mortgage Type
Seller Take Back
Purchase Details
Closed on
Jan 17, 1995
Sold by
Edgcomb Thelma L
Bought by
Buchanan Doris T and Temples Doris Buchanan
Create a Home Valuation Report for This Property
The Home Valuation Report is an in-depth analysis detailing your home's value as well as a comparison with similar homes in the area
Home Values in the Area
Average Home Value in this Area
Purchase History
| Date | Buyer | Sale Price | Title Company |
|---|---|---|---|
| Wells Nicholas | -- | Accommodation | |
| Wells Nicholas Noviello | -- | Chicago Title Co | |
| Noviello Nicholas | $97,000 | -- | |
| Buchanan Doris T | $75,000 | -- |
Source: Public Records
Mortgage History
| Date | Status | Borrower | Loan Amount |
|---|---|---|---|
| Closed | Wells Nicholas Noviello | $92,000 | |
| Previous Owner | Noviello Nicholas | $87,000 |
Source: Public Records
Tax History
| Year | Tax Paid | Tax Assessment Tax Assessment Total Assessment is a certain percentage of the fair market value that is determined by local assessors to be the total taxable value of land and additions on the property. | Land | Improvement |
|---|---|---|---|---|
| 2025 | $3,087 | $215,534 | $159,665 | $55,869 |
| 2024 | $3,087 | $211,309 | $156,535 | $54,774 |
| 2023 | $3,019 | $207,166 | $153,466 | $53,700 |
| 2022 | $2,936 | $203,105 | $150,457 | $52,648 |
| 2021 | $2,881 | $199,123 | $147,507 | $51,616 |
| 2020 | $2,798 | $197,082 | $145,995 | $51,087 |
| 2019 | $2,753 | $193,219 | $143,133 | $50,086 |
| 2018 | $2,616 | $189,431 | $140,327 | $49,104 |
| 2016 | $2,519 | $182,078 | $134,879 | $47,199 |
| 2015 | $2,468 | $179,344 | $132,853 | $46,491 |
| 2014 | $2,455 | $175,832 | $130,251 | $45,581 |
Source: Public Records
Map
Nearby Homes
- 215 S 5th Ave Unit A
- 417 California St Unit F
- 415 California St Unit D
- 523 S 5th Ave Unit B
- 527 S 5th Ave Unit B
- 601 S 5th Ave Unit B
- 424 Genoa St
- 200 S 2nd Ave Unit A
- 200 S 2nd Ave Unit B
- 200 S 2nd Ave Unit D
- 200 S 2nd Ave Unit C
- 714 Genoa St
- 165 Bonita St Unit B
- 154 Diamond St Unit B
- 147 California St
- 910 S 5th Ave
- 855 W Walnut Ave
- 135 Diamond St
- 125 Diamond St Unit H
- 919 W Olive Ave Unit B
- 1407 Contented Ln
- 1411 Contented Ln
- 928 Sierra Blanca Dr
- 1402 Contented Ln
- 1413 Contented Ln
- 930 Sierra Blanca Dr
- 1412 Contented Ln
- 927 Sierra Blanca Dr
- 1417 Contented Ln
- 903 Diamond St
- 932 Sierra Blanca Dr
- 929 Sierra Blanca Dr
- 1405 Encino Ave
- 1419 Contented Ln
- 935 Sierra Blanca Dr
- 1418 Contented Ln
- 934 Sierra Blanca Dr
- 1403 Encino Ave
- 1326 S 5th Ave
- 939 Sierra Blanca Dr
Your Personal Tour Guide
Ask me questions while you tour the home.