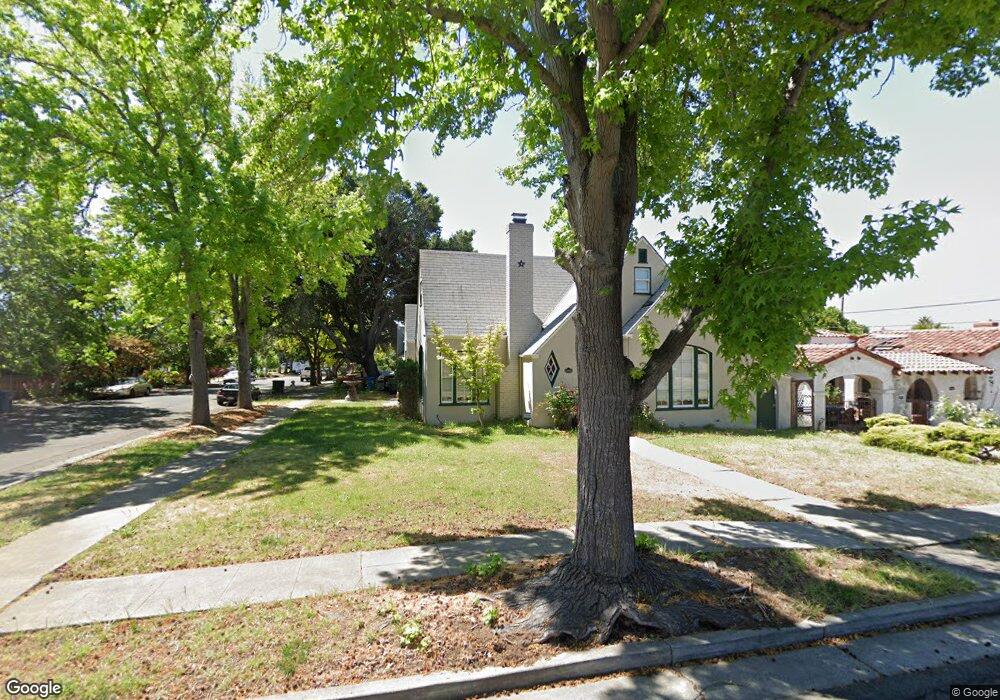
1321 Illinois St Vallejo, CA 94590
West Vallejo NeighborhoodEstimated Value: $607,000 - $789,000
5
Beds
3
Baths
1,642
Sq Ft
$420/Sq Ft
Est. Value
About This Home
This home is located at 1321 Illinois St, Vallejo, CA 94590 and is currently estimated at $689,732, approximately $420 per square foot. 1321 Illinois St is a home located in Solano County with nearby schools including Highland Elementary, Vallejo High School, and Caliber: ChangeMakers Academy.
Ownership History
Date
Name
Owned For
Owner Type
Purchase Details
Closed on
Nov 12, 2023
Sold by
Devine Janessa Lee
Bought by
Janessa L Devine Living Trust and Devine
Current Estimated Value
Purchase Details
Closed on
Nov 13, 2019
Sold by
Price Janessa
Bought by
Price Janessa
Home Financials for this Owner
Home Financials are based on the most recent Mortgage that was taken out on this home.
Original Mortgage
$400,000
Interest Rate
3.75%
Mortgage Type
New Conventional
Purchase Details
Closed on
Jan 20, 2012
Sold by
Calderon Ronald
Bought by
Price Janessa
Purchase Details
Closed on
Mar 18, 2004
Sold by
Hope Joyce A
Bought by
Calderon Ronald and Price Janessa
Home Financials for this Owner
Home Financials are based on the most recent Mortgage that was taken out on this home.
Original Mortgage
$410,000
Interest Rate
5.15%
Mortgage Type
Purchase Money Mortgage
Create a Home Valuation Report for This Property
The Home Valuation Report is an in-depth analysis detailing your home's value as well as a comparison with similar homes in the area
Home Values in the Area
Average Home Value in this Area
Purchase History
| Date | Buyer | Sale Price | Title Company |
|---|---|---|---|
| Janessa L Devine Living Trust | -- | None Listed On Document | |
| Price Janessa | -- | First American Title Ins Co | |
| Price Janessa | -- | None Available | |
| Calderon Ronald | $512,500 | North American Title Co |
Source: Public Records
Mortgage History
| Date | Status | Borrower | Loan Amount |
|---|---|---|---|
| Previous Owner | Price Janessa | $400,000 | |
| Previous Owner | Calderon Ronald | $410,000 | |
| Closed | Calderon Ronald | $102,500 |
Source: Public Records
Tax History Compared to Growth
Tax History
| Year | Tax Paid | Tax Assessment Tax Assessment Total Assessment is a certain percentage of the fair market value that is determined by local assessors to be the total taxable value of land and additions on the property. | Land | Improvement |
|---|---|---|---|---|
| 2025 | $8,850 | $695,089 | $6,366 | $688,723 |
| 2024 | $8,850 | $681,461 | $6,242 | $675,219 |
| 2023 | $8,430 | $668,100 | $6,120 | $661,980 |
| 2022 | $8,481 | $655,000 | $6,000 | $649,000 |
| 2021 | $8,063 | $631,000 | $12,000 | $619,000 |
| 2020 | $7,199 | $544,000 | $16,000 | $528,000 |
| 2019 | $7,057 | $537,000 | $21,000 | $516,000 |
| 2018 | $6,297 | $504,000 | $25,000 | $479,000 |
| 2017 | $5,486 | $444,000 | $26,000 | $418,000 |
| 2016 | $4,585 | $406,000 | $28,000 | $378,000 |
| 2015 | $4,172 | $369,000 | $26,000 | $343,000 |
| 2014 | $3,714 | $327,000 | $26,000 | $301,000 |
Source: Public Records
Map
Nearby Homes
- 1415 Illinois St
- 1411 Tennessee St
- 1124 Tuolumne St
- 1148 Nebraska St
- 17 Hanns Ave
- 1457 Alabama St
- 121 Bella Vista Way
- 1467 Ohio St
- 1445 Ohio St
- 1038 Alabama St
- 900 Alameda St
- 1086 Calaveras Way
- 468 Springs Rd
- 1636 Ohio St
- 135 Bayview Ave
- 1131 Tennessee St
- 1121 Ohio St
- 1208 Florida St
- 1210 Florida St
- 1016 Ohio St
- 1315 Illinois St
- 53 Carroll St
- 1309 Illinois St
- 1401 Illinois St
- 51 Carroll St
- 1344 Glenn St
- 52 Carroll St
- 1301 Illinois St
- 1316 Illinois St
- 1405 Illinois St
- 1310 Illinois St
- 45 Carroll St
- 46 Carroll St
- 1338 Glenn St
- 1402 Illinois St
- 40 Carroll St
- 1404 Illinois St
- 1400 Glenn St
- 1332 Glenn St
- 39 Carroll St