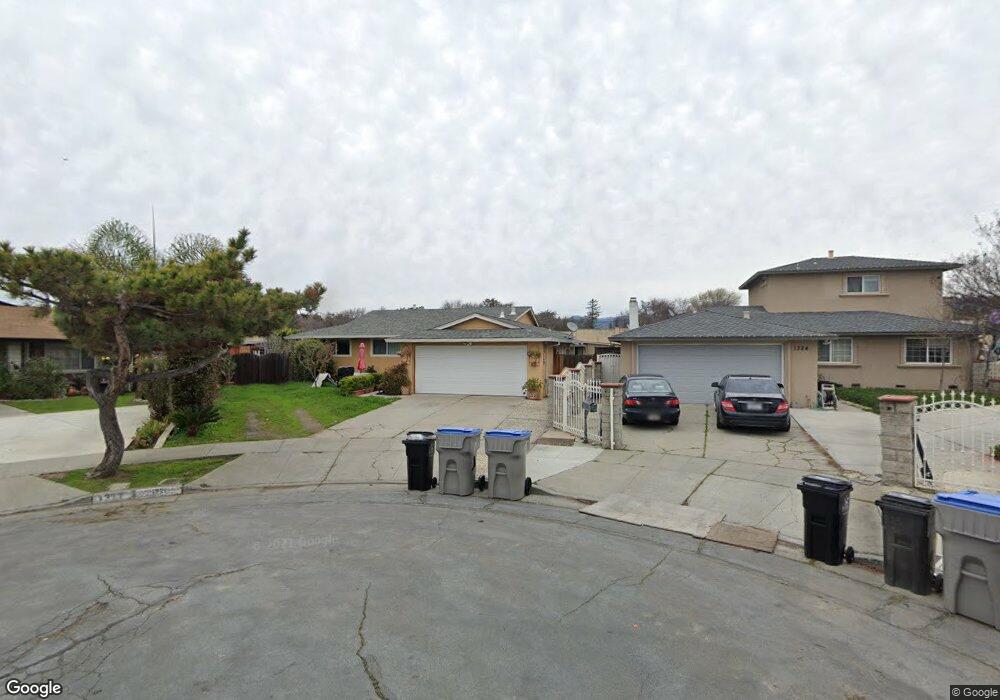
1321 Mayhew Ct San Jose, CA 95121
Stonegate NeighborhoodEstimated Value: $1,062,000 - $1,140,000
3
Beds
2
Baths
1,232
Sq Ft
$898/Sq Ft
Est. Value
About This Home
This home is located at 1321 Mayhew Ct, San Jose, CA 95121 and is currently estimated at $1,106,621, approximately $898 per square foot. 1321 Mayhew Ct is a home located in Santa Clara County with nearby schools including Windmill Springs Elementary School, Sylvandale Middle School, and Yerba Buena High School.
Ownership History
Date
Name
Owned For
Owner Type
Purchase Details
Closed on
Aug 21, 2000
Sold by
Christine Silva and Silva John A
Bought by
Arciniega Jose Carlos and Madrigal Rocio R
Current Estimated Value
Home Financials for this Owner
Home Financials are based on the most recent Mortgage that was taken out on this home.
Original Mortgage
$237,300
Outstanding Balance
$91,364
Interest Rate
9.1%
Estimated Equity
$1,015,257
Create a Home Valuation Report for This Property
The Home Valuation Report is an in-depth analysis detailing your home's value as well as a comparison with similar homes in the area
Home Values in the Area
Average Home Value in this Area
Purchase History
| Date | Buyer | Sale Price | Title Company |
|---|---|---|---|
| Arciniega Jose Carlos | $339,000 | Financial Title Company |
Source: Public Records
Mortgage History
| Date | Status | Borrower | Loan Amount |
|---|---|---|---|
| Open | Arciniega Jose Carlos | $237,300 | |
| Closed | Arciniega Jose Carlos | $101,700 |
Source: Public Records
Tax History
| Year | Tax Paid | Tax Assessment Tax Assessment Total Assessment is a certain percentage of the fair market value that is determined by local assessors to be the total taxable value of land and additions on the property. | Land | Improvement |
|---|---|---|---|---|
| 2025 | $7,925 | $510,423 | $135,603 | $374,820 |
| 2024 | $7,925 | $500,416 | $132,945 | $367,471 |
| 2023 | $7,812 | $490,605 | $130,339 | $360,266 |
| 2022 | $7,643 | $480,986 | $127,784 | $353,202 |
| 2021 | $7,591 | $471,556 | $125,279 | $346,277 |
| 2020 | $7,321 | $466,722 | $123,995 | $342,727 |
| 2019 | $7,022 | $457,571 | $121,564 | $336,007 |
| 2018 | $7,008 | $448,600 | $119,181 | $329,419 |
| 2017 | $6,914 | $439,805 | $116,845 | $322,960 |
| 2016 | $6,574 | $431,182 | $114,554 | $316,628 |
| 2015 | $6,438 | $424,706 | $112,834 | $311,872 |
| 2014 | $5,965 | $416,387 | $110,624 | $305,763 |
Source: Public Records
Map
Nearby Homes
- 2582 Tosca Way
- 2690 Mclaughlin Ave
- 2739 Mclaughlin Ave
- 1227 Letitia Ct
- 1079 Drexel Way
- 1138 Bellingham Dr
- 2651 Ophelia Ave
- 2372 Balme Dr
- 2606 Apollo Dr
- 1573 Redfield Ct
- 1207 Spokane Dr
- 2456 Kenoga Dr
- 3016 Shadow Springs Place Unit 113
- 2186 Bikini Ave
- 2315 Warfield Way Unit B
- 2051 Edgegate Dr
- 3135 Oakbridge Dr Unit 3135
- 2261 Summerton Dr Unit 32
- 3241 Shadow Park Place
- 2217 Summereve Ct
Your Personal Tour Guide
Ask me questions while you tour the home.