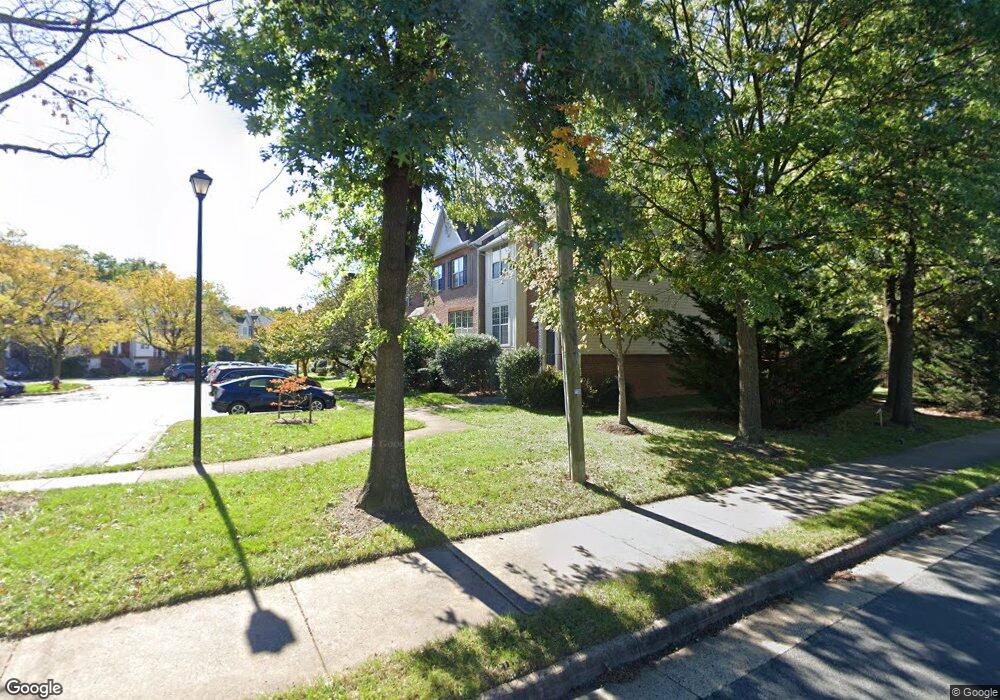
13211 Ashnut Ln Herndon, VA 20171
Estimated Value: $645,784 - $668,000
3
Beds
4
Baths
2,436
Sq Ft
$269/Sq Ft
Est. Value
About This Home
This home is located at 13211 Ashnut Ln, Herndon, VA 20171 and is currently estimated at $655,196, approximately $268 per square foot. 13211 Ashnut Ln is a home located in Fairfax County with nearby schools including Mcnair Elementary School, McNair Upper Elementary School, and Rachel Carson Middle School.
Ownership History
Date
Name
Owned For
Owner Type
Purchase Details
Closed on
Jun 18, 2010
Sold by
Riccardi Paul V
Bought by
Ramsetty Sowjanya and Chintapalli Sriram
Current Estimated Value
Home Financials for this Owner
Home Financials are based on the most recent Mortgage that was taken out on this home.
Original Mortgage
$361,351
Outstanding Balance
$242,890
Interest Rate
5.03%
Mortgage Type
FHA
Estimated Equity
$412,306
Purchase Details
Closed on
Apr 30, 2002
Sold by
Webster Lisa
Bought by
Riccardi Paul
Home Financials for this Owner
Home Financials are based on the most recent Mortgage that was taken out on this home.
Original Mortgage
$218,000
Interest Rate
7.13%
Mortgage Type
New Conventional
Purchase Details
Closed on
Jan 30, 1995
Sold by
Property Dev Inc
Bought by
Webster Udey H
Home Financials for this Owner
Home Financials are based on the most recent Mortgage that was taken out on this home.
Original Mortgage
$174,000
Interest Rate
9.24%
Create a Home Valuation Report for This Property
The Home Valuation Report is an in-depth analysis detailing your home's value as well as a comparison with similar homes in the area
Home Values in the Area
Average Home Value in this Area
Purchase History
| Date | Buyer | Sale Price | Title Company |
|---|---|---|---|
| Ramsetty Sowjanya | $372,000 | -- | |
| Riccardi Paul | $272,500 | -- | |
| Webster Udey H | $183,337 | -- |
Source: Public Records
Mortgage History
| Date | Status | Borrower | Loan Amount |
|---|---|---|---|
| Open | Ramsetty Sowjanya | $361,351 | |
| Previous Owner | Riccardi Paul | $218,000 | |
| Previous Owner | Webster Udey H | $174,000 |
Source: Public Records
Tax History Compared to Growth
Tax History
| Year | Tax Paid | Tax Assessment Tax Assessment Total Assessment is a certain percentage of the fair market value that is determined by local assessors to be the total taxable value of land and additions on the property. | Land | Improvement |
|---|---|---|---|---|
| 2025 | $6,427 | $577,250 | $180,000 | $397,250 |
| 2024 | $6,427 | $554,810 | $170,000 | $384,810 |
| 2023 | $6,035 | $534,770 | $170,000 | $364,770 |
| 2022 | $5,701 | $498,580 | $155,000 | $343,580 |
| 2021 | $5,413 | $461,280 | $135,000 | $326,280 |
| 2020 | $5,406 | $456,740 | $135,000 | $321,740 |
| 2019 | $5,336 | $450,850 | $135,000 | $315,850 |
| 2018 | $4,864 | $422,980 | $115,000 | $307,980 |
| 2017 | $4,824 | $415,500 | $110,000 | $305,500 |
| 2016 | $4,838 | $417,570 | $110,000 | $307,570 |
| 2015 | $4,560 | $408,610 | $110,000 | $298,610 |
| 2014 | $4,391 | $394,300 | $110,000 | $284,300 |
Source: Public Records
Map
Nearby Homes
- 2447 Clover Field Cir
- 13210 Fox Ripple Ln
- 13123 Copper Brook Way
- 13116 Marcey Creek Rd Unit 13116
- 2506 James Monroe Cir
- 2522 Logan Wood Dr
- 2505 James Madison Cir
- 2410 Dakota Lakes Dr
- 12901 Cedar Glen Ln
- 2448 Rolling Plains Dr
- 13103 Anvil Place
- 3495 Audubon Cove
- 3499 Audubon Cove
- 12968 Wood Crescent Cir
- 12917 Wood Crescent Cir
- 2492 Quick St Unit 103
- 13438 Burrough Farm Dr
- 12921 Centre Park Cir Unit 303
- 12956 Centre Park Cir Unit 417
- 12925 Centre Park Cir Unit 311
- 13209 Ashnut Ln
- 13213 Ashnut Ln
- 13207 Ashnut Ln
- 13205 Ashnut Ln
- 13203 Ashnut Ln
- 13201 Ashnut Ln
- 2401 Fieldcreek Dr
- 2405 Fieldcreek Dr
- 2409 Fieldcreek Dr
- 2411 Fieldcreek Dr
- 2417 Fieldcreek Dr
- 2419 Fieldcreek Dr
- 2415 Fieldcreek Dr
- 2421 Fieldcreek Dr
- 2423 Fieldcreek Dr
- 13200 Ashnut Ln
- 13198 Ashnut Ln
- 13196 Ashnut Ln
- 13212 Ashnut Ln
- 13208 Ashnut Ln