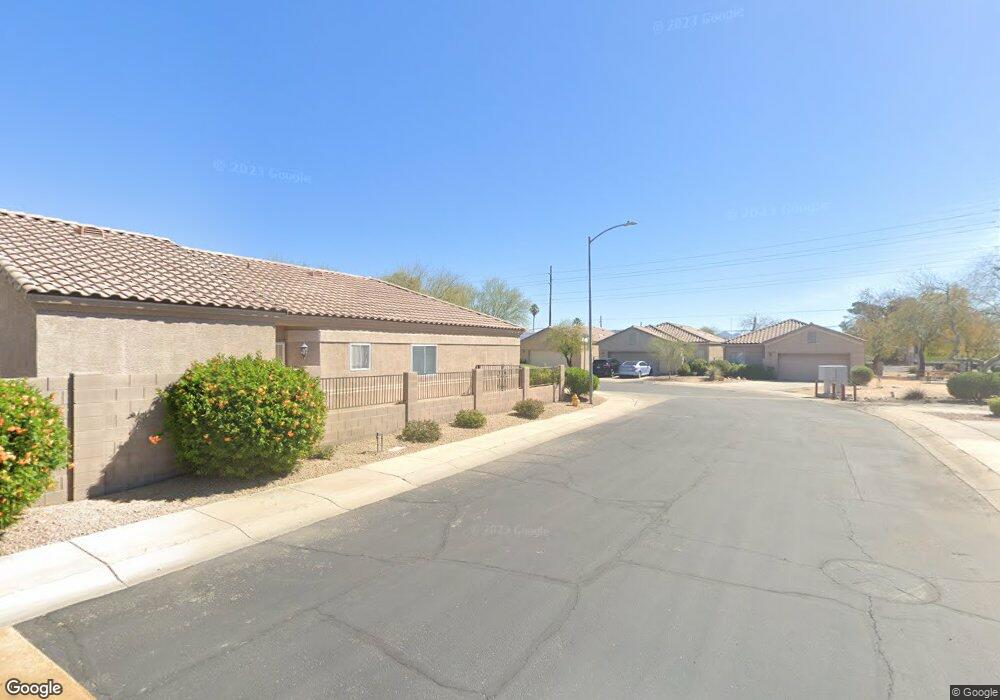
13213 N 31st Way Phoenix, AZ 85032
Paradise Valley Village NeighborhoodEstimated Value: $389,981 - $463,000
3
Beds
2
Baths
1,475
Sq Ft
$295/Sq Ft
Est. Value
About This Home
This home is located at 13213 N 31st Way, Phoenix, AZ 85032 and is currently estimated at $434,995, approximately $294 per square foot. 13213 N 31st Way is a home located in Maricopa County with nearby schools including Larkspur Elementary School, Shea Middle School, and Shadow Mountain High School.
Ownership History
Date
Name
Owned For
Owner Type
Purchase Details
Closed on
Jul 5, 2021
Sold by
Brown Spencer A
Bought by
Sab-Glb Family Trust and Brown
Current Estimated Value
Purchase Details
Closed on
Nov 8, 2011
Sold by
Irving Donna M
Bought by
Brown Spencer
Home Financials for this Owner
Home Financials are based on the most recent Mortgage that was taken out on this home.
Original Mortgage
$104,000
Interest Rate
3.95%
Mortgage Type
New Conventional
Purchase Details
Closed on
Jan 28, 2009
Sold by
Irving Donna M
Bought by
Irving Donna M and The Donna M Irving Living Trust
Purchase Details
Closed on
Nov 16, 1998
Sold by
Cambridge Homes Llc
Bought by
Irving James W and Irving Donna M
Home Financials for this Owner
Home Financials are based on the most recent Mortgage that was taken out on this home.
Original Mortgage
$108,450
Interest Rate
6.82%
Mortgage Type
New Conventional
Create a Home Valuation Report for This Property
The Home Valuation Report is an in-depth analysis detailing your home's value as well as a comparison with similar homes in the area
Home Values in the Area
Average Home Value in this Area
Purchase History
| Date | Buyer | Sale Price | Title Company |
|---|---|---|---|
| Sab-Glb Family Trust | -- | None Listed On Document | |
| Brown Spencer | $130,000 | Chicago Title | |
| Irving Donna M | -- | None Available | |
| Irving James W | $120,257 | Transnation Title Ins Co |
Source: Public Records
Mortgage History
| Date | Status | Borrower | Loan Amount |
|---|---|---|---|
| Previous Owner | Brown Spencer | $104,000 | |
| Previous Owner | Irving James W | $108,450 |
Source: Public Records
Tax History Compared to Growth
Tax History
| Year | Tax Paid | Tax Assessment Tax Assessment Total Assessment is a certain percentage of the fair market value that is determined by local assessors to be the total taxable value of land and additions on the property. | Land | Improvement |
|---|---|---|---|---|
| 2025 | $1,532 | $15,390 | -- | -- |
| 2024 | $1,500 | $14,657 | -- | -- |
| 2023 | $1,500 | $31,500 | $6,300 | $25,200 |
| 2022 | $1,485 | $25,210 | $5,040 | $20,170 |
| 2021 | $1,489 | $21,630 | $4,320 | $17,310 |
| 2020 | $1,443 | $20,560 | $4,110 | $16,450 |
| 2019 | $1,445 | $18,900 | $3,780 | $15,120 |
| 2018 | $1,194 | $15,950 | $3,190 | $12,760 |
| 2017 | $1,141 | $14,800 | $2,960 | $11,840 |
| 2016 | $1,123 | $14,630 | $2,920 | $11,710 |
| 2015 | $1,042 | $14,050 | $2,810 | $11,240 |
Source: Public Records
Map
Nearby Homes
- 3042 E Roveen Ave
- 13411 N 30th St
- 13608 N 33rd St
- 3301 E Sharon Dr
- 13423 N 29th Place
- 13035 N 34th St Unit 11
- 13017 N 29th St
- 3009 E Dahlia Dr
- 3010 E Corrine Dr
- 2810 E Willow Ave
- 2827 E Captain Dreyfus Ave
- 13829 N 34th St
- 3016 E Larkspur Dr
- 2939 E Corrine Dr
- 3455 E Sharon Dr
- 13008 N 28th Place
- 2831 E Dahlia Dr
- 2902 E Corrine Dr
- 2960 E Larkspur Dr
- 13036 N 36th St
- 13217 N 31st Way
- 13209 N 31st Way
- 13221 N 31st Way
- 13207 N 31st Way
- 13225 N 31st Way
- 13203 N 31st Way
- 13216 N 31st Way
- 13212 N 31st Way
- 13220 N 31st Way
- 13231 N 31st Way
- 13208 N 31st Way
- 13224 N 31st Way
- 13228 N 31st Way
- 13235 N 31st Way
- 3149 E Pershing Ave
- 13232 N 31st Way
- 3202 E Pershing Ave
- 3201 E Andorra Dr Unit 2
- 3145 E Pershing Ave
- 13237 N 31st Way