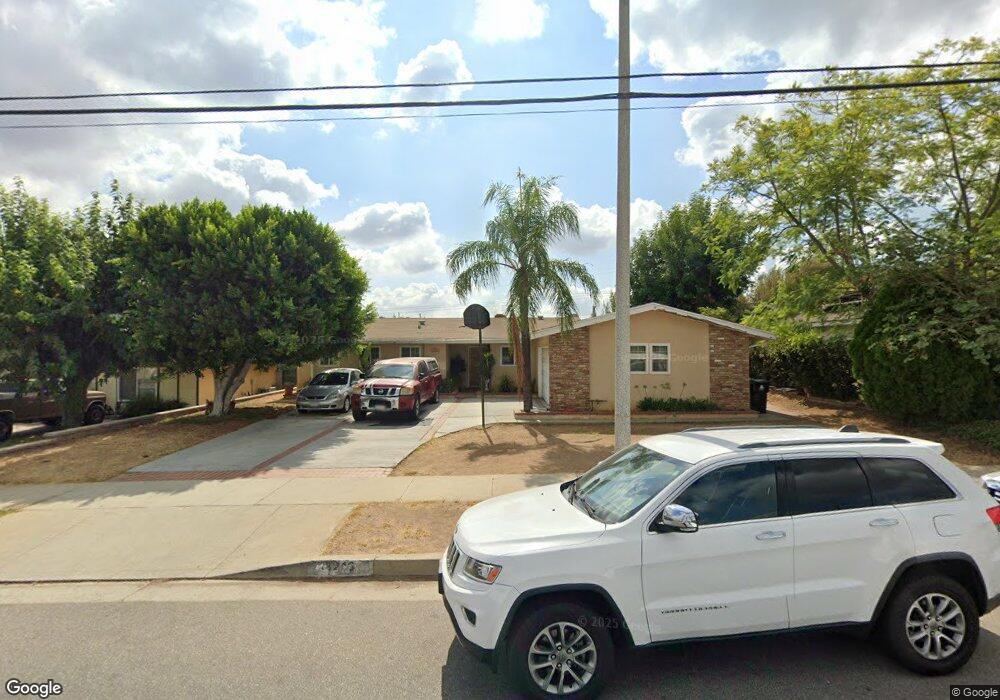
13216 Fernmont St Sylmar, CA 91342
Estimated Value: $673,000 - $795,000
3
Beds
2
Baths
1,118
Sq Ft
$657/Sq Ft
Est. Value
About This Home
This home is located at 13216 Fernmont St, Sylmar, CA 91342 and is currently estimated at $734,577, approximately $657 per square foot. 13216 Fernmont St is a home located in Los Angeles County with nearby schools including Harding Street Elementary School, San Fernando Middle School, and San Fernando Senior High School.
Ownership History
Date
Name
Owned For
Owner Type
Purchase Details
Closed on
Mar 11, 2020
Sold by
Martinez Maria C
Bought by
Martinez Maria C and The Maria C Martinez Reovcable
Current Estimated Value
Purchase Details
Closed on
Sep 22, 1993
Sold by
Morfin Martin
Bought by
Morfin Rigoberto
Home Financials for this Owner
Home Financials are based on the most recent Mortgage that was taken out on this home.
Original Mortgage
$151,152
Interest Rate
6.94%
Mortgage Type
FHA
Purchase Details
Closed on
Sep 7, 1993
Sold by
Morfin Rigoberto and Morfin Rocio A
Bought by
Martinez Miguel
Home Financials for this Owner
Home Financials are based on the most recent Mortgage that was taken out on this home.
Original Mortgage
$151,152
Interest Rate
6.94%
Mortgage Type
FHA
Create a Home Valuation Report for This Property
The Home Valuation Report is an in-depth analysis detailing your home's value as well as a comparison with similar homes in the area
Home Values in the Area
Average Home Value in this Area
Purchase History
| Date | Buyer | Sale Price | Title Company |
|---|---|---|---|
| Martinez Maria C | -- | None Available | |
| Martinez Maria C | -- | None Available | |
| Morfin Rigoberto | -- | World Title Company | |
| Martinez Miguel | $152,909 | World Title Company |
Source: Public Records
Mortgage History
| Date | Status | Borrower | Loan Amount |
|---|---|---|---|
| Closed | Martinez Miguel | $151,152 |
Source: Public Records
Tax History Compared to Growth
Tax History
| Year | Tax Paid | Tax Assessment Tax Assessment Total Assessment is a certain percentage of the fair market value that is determined by local assessors to be the total taxable value of land and additions on the property. | Land | Improvement |
|---|---|---|---|---|
| 2025 | $3,378 | $259,842 | $121,167 | $138,675 |
| 2024 | $3,378 | $254,748 | $118,792 | $135,956 |
| 2023 | $3,318 | $249,754 | $116,463 | $133,291 |
| 2022 | $3,170 | $244,858 | $114,180 | $130,678 |
| 2021 | $3,129 | $240,058 | $111,942 | $128,116 |
| 2019 | $3,041 | $232,940 | $108,623 | $124,317 |
| 2018 | $2,970 | $228,374 | $106,494 | $121,880 |
| 2016 | $2,835 | $219,508 | $102,359 | $117,149 |
| 2015 | $2,796 | $216,212 | $100,822 | $115,390 |
| 2014 | $2,814 | $211,978 | $98,848 | $113,130 |
Source: Public Records
Map
Nearby Homes
- 12745 N Watt Ln Unit B
- 12745 N Watt Ln Unit B
- 13219 Shaw Ln
- 13384 Foothill Blvd
- 13912 N Mesa Alta Rd
- 12888 Four Palms Ln
- 13197 Leach St
- 12940 Harding St
- 13247 Tripoli Ave
- 13550 Foothill Blvd Unit 27
- 13540 Hubbard St Unit 21
- 12826 Bromont Ave
- 13372 Hyland Ct
- 1425 8th St
- 13475 Hubbard St Unit 31
- 12547 Cometa Ave
- 1965 8th St
- 13750 Hubbard St Unit 77
- 13414 Herron St
- 13002 Dronfield Ave
- 13208 Fernmont St
- 13224 Fernmont St
- 13187 Chesterwood St
- 13181 Chesterwood St
- 13200 Fernmont St
- 13191 Chesterwood St
- 12930 Gladstone Ave
- 13173 Chesterwood St
- 13194 Fernmont St
- 13190 Chesterwood St
- 13165 Chesterwood St
- 13182 Chesterwood St
- 12940 Gladstone Ave
- 13174 Chesterwood St
- 12907 Gladstone Ave
- 13188 Fernmont St
- 12917 Gladstone Ave
- 12901 Gladstone Ave
- 13168 Chesterwood St
- 13159 Chesterwood St