1322 Maple Ln Lawrence, KS 66044
Brook Creek NeighborhoodEstimated Value: $380,000 - $470,731
About This Home
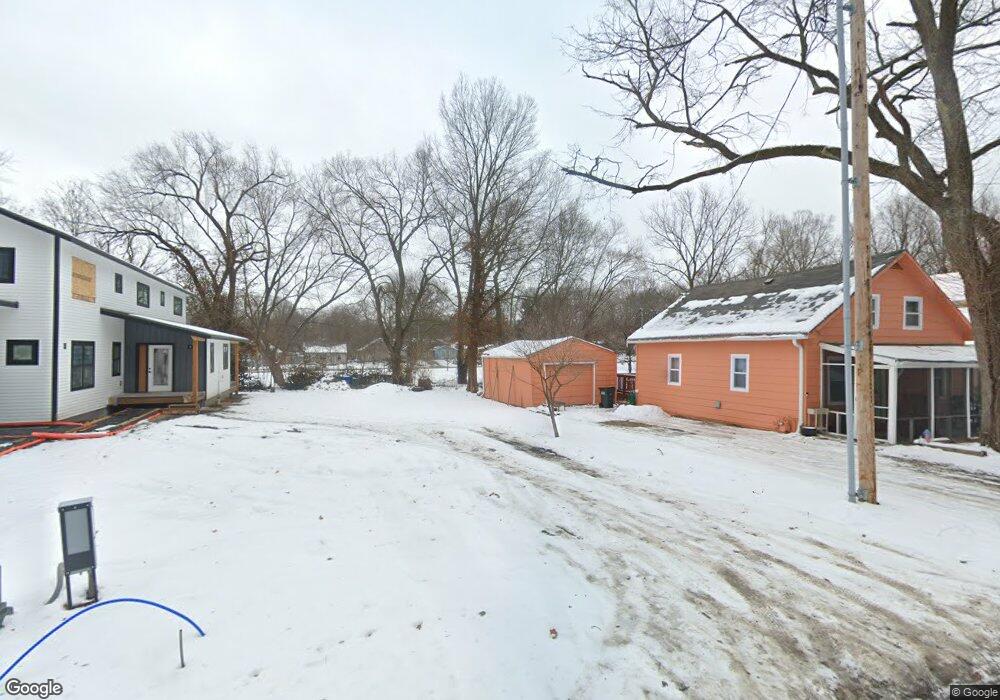
This home is located at 1322 Maple Ln, Lawrence, KS 66044 and is currently estimated at $446,183, approximately $214 per square foot. 1322 Maple Ln is a home located in Douglas County with nearby schools including New York Elementary School, Liberty Memorial Central Middle School, and Lawrence Free State High School.
Ownership History
We collect this data history from publicly available records. To have your information removed, we recommend requesting removal directly through your county’s website.
Purchase Details
Home Financials for this Owner
Home Financials are based on the most recent Mortgage that was taken out on this home.Purchase Details
Purchase Details
Home Financials for this Owner
Home Financials are based on the most recent Mortgage that was taken out on this home.Home Values in the Area
Average Home Value in this Area
Purchase History
We collect this data history from publicly available records. To have your information removed, we recommend requesting removal directly through your county’s website.
| Date | Buyer | Sale Price | Title Company |
|---|---|---|---|
| -- | Continental Title | ||
| -- | Continental Title | ||
| $75,000 | None Available |
Mortgage History
We collect this data history from publicly available records. To have your information removed, we recommend requesting removal directly through your county’s website.
| Date | Status | Borrower | Loan Amount |
|---|---|---|---|
| Open | $415,150 | ||
| Previous Owner | $60,000 |
Tax History
We collect this data history from publicly available records. To have your information removed, we recommend requesting removal directly through your county’s website.
| Year | Tax Paid | Tax Assessment Tax Assessment Total Assessment is a certain percentage of the fair market value that is determined by local assessors to be the total taxable value of land and additions on the property. | Land | Improvement |
|---|---|---|---|---|
| 2025 | $6,272 | $50,255 | $5,750 | $44,505 |
| 2024 | $4,205 | $34,119 | $5,405 | $28,714 |
| 2023 | $708 | $5,400 | $5,400 | $0 |
| 2022 | $1,473 | $11,857 | $4,600 | $7,257 |
| 2021 | $1,186 | $11,305 | $4,368 | $6,937 |
| 2020 | $1,373 | $10,560 | $4,368 | $6,192 |
| 2019 | $1,304 | $10,056 | $3,798 | $6,258 |
| 2018 | $1,226 | $9,404 | $3,571 | $5,833 |
| 2017 | $1,230 | $9,331 | $3,571 | $5,760 |
| 2016 | $1,084 | $8,625 | $3,450 | $5,175 |
| 2015 | $1,084 | $8,625 | $3,450 | $5,175 |
| 2014 | $1,266 | $10,112 | $3,450 | $6,662 |
Map
- 1418 Maple Ln
- 1201 E 13th St
- 1200 Oak Hill Ave
- 1219 Brook St
- 1447 Summit St
- 1328 E 16th St
- 931 Anna Tappan Way
- 907 Anna Tappan Way
- 903 Anna Tappan Way
- 1603 Harper St
- 1618 E Glenn Dr
- 1327 New Jersey St
- 1118 Pennsylvania St
- 1615 E Glenn Dr
- 1828 Brook St
- 1531 Wedgewood Dr
- 1508 E 18th Terrace
- 1128 New York St
- 1111 New Jersey St
- 717 Beatnik Ct
Ask me questions while you tour the home.