13222 Bloom St HamtraMcK, MI 48212
Buffalo Charles NeighborhoodEstimated Value: $160,000 - $235,000
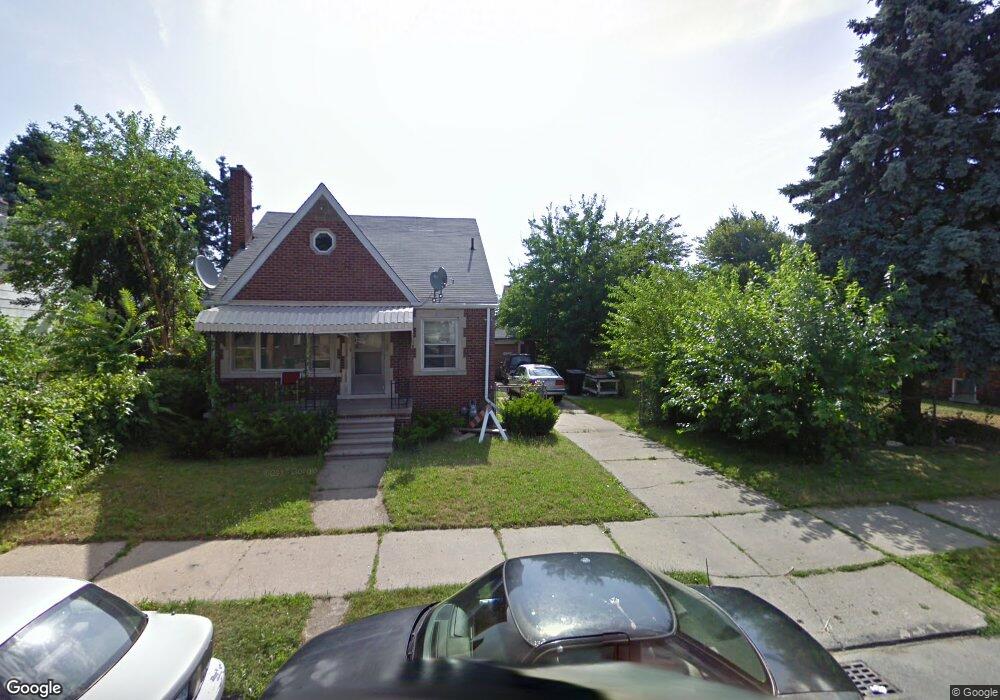
About This Home
This home is located at 13222 Bloom St, HamtraMcK, MI 48212 and is currently estimated at $192,199, approximately $194 per square foot. 13222 Bloom St is a home located in Wayne County with nearby schools including Davison Elementary-Middle School, Edward 'Duke' Ellington Conservatory of Music and Art, and Charles L. Spain Elementary-Middle School.
Ownership History
Purchase Details
Purchase Details
Purchase Details
Home Financials for this Owner
Home Financials are based on the most recent Mortgage that was taken out on this home.Purchase Details
Home Values in the Area
Average Home Value in this Area
Purchase History
We collect this data history from publicly available records. To have your information removed, we recommend requesting removal directly through your county’s website.
| Date | Buyer | Sale Price | Title Company |
|---|---|---|---|
| Zindani Shayma Abdo | $5,000 | None Available | |
| Al Nadhari Yahya Ahmed | $11,500 | Title Connect Llc | |
| Qoria Hamood Ali | $72,000 | None Available | |
| Zindani Kalel | $62,000 | Multiple |
Mortgage History
We collect this data history from publicly available records. To have your information removed, we recommend requesting removal directly through your county’s website.
| Date | Status | Borrower | Loan Amount |
|---|---|---|---|
| Previous Owner | Qoria Hamood Ali | $68,400 |
Tax History
| Year | Tax Paid | Tax Assessment Tax Assessment Total Assessment is a certain percentage of the fair market value that is determined by local assessors to be the total taxable value of land and additions on the property. | Land | Improvement |
|---|---|---|---|---|
| 2025 | $1,690 | $60,000 | $0 | $0 |
| 2024 | $1,668 | $38,600 | $0 | $0 |
| 2023 | $1,620 | $31,300 | $0 | $0 |
| 2022 | $1,733 | $29,300 | $0 | $0 |
| 2021 | $1,683 | $21,100 | $0 | $0 |
| 2020 | $1,683 | $19,500 | $0 | $0 |
| 2019 | $1,656 | $16,000 | $0 | $0 |
| 2018 | $876 | $15,500 | $0 | $0 |
| 2017 | $201 | $14,200 | $0 | $0 |
| 2016 | $983 | $35,400 | $0 | $0 |
| 2015 | $1,230 | $12,300 | $0 | $0 |
| 2013 | $1,540 | $15,402 | $0 | $0 |
| 2010 | -- | $22,580 | $1,176 | $21,404 |
Map
- 13242 Buffalo St
- 13463 Buffalo St
- 13291 Sparling St
- 5092 Charles St
- 5056 Charles St
- 13500 Fenelon St
- 13757 Sparling St
- 13281 Gable St
- 5039 Fredro St
- 11839 Gable St
- 13401 Justine St
- 13512 Gable St
- 13469 Dwyer St
- 12940 Dwyer St
- 12932 Dwyer St
- 5658 Talbot St
- 5566 Talbot St
- 11719 Gable St
- 5574 Talbot St
- 13446 Dwyer St
- 13216 Bloom St
- 13232 Bloom St
- 13210 Bloom St
- 13242 Bloom St
- 13202 Bloom St
- 13223 Buffalo St
- 13229 Buffalo St
- 13217 Buffalo St
- 13250 Bloom St
- 13209 Buffalo St
- 13245 Buffalo St
- 13203 Buffalo St
- 13256 Bloom St
- 13233 Bloom St
- 13239 Bloom St
- 13217 Bloom St
- 13249 Buffalo St
- 13136 Bloom St
- 13211 Bloom St
- 13262 Bloom St
Ask me questions while you tour the home.