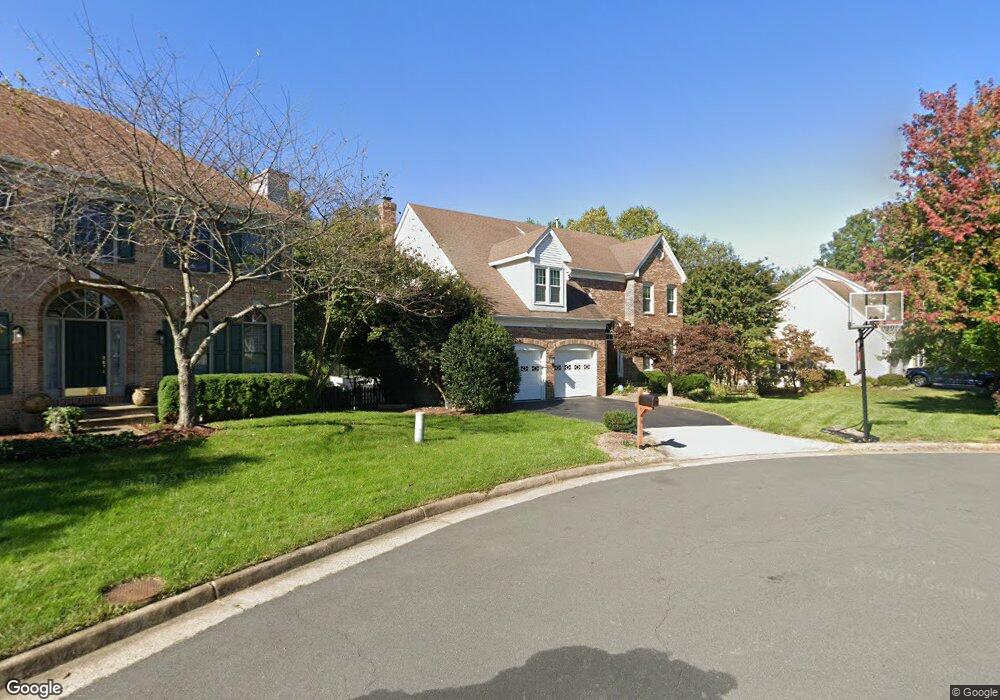
13229 Stable Brook Way Herndon, VA 20171
Estimated Value: $1,005,000 - $1,160,000
4
Beds
3
Baths
2,908
Sq Ft
$369/Sq Ft
Est. Value
About This Home
This home is located at 13229 Stable Brook Way, Herndon, VA 20171 and is currently estimated at $1,074,438, approximately $369 per square foot. 13229 Stable Brook Way is a home located in Fairfax County with nearby schools including Floris Elementary School, Rachel Carson Middle School, and South Lakes High School.
Ownership History
Date
Name
Owned For
Owner Type
Purchase Details
Closed on
May 22, 2019
Sold by
Luongo John M and Luongo Kathleen M
Bought by
Luongo John M and Luongo Kathleen M
Current Estimated Value
Purchase Details
Closed on
Dec 1, 1999
Sold by
Bogart Jeffrey J
Bought by
Mccue Kathleen M and Luongo,John M
Home Financials for this Owner
Home Financials are based on the most recent Mortgage that was taken out on this home.
Original Mortgage
$304,000
Interest Rate
7.86%
Purchase Details
Closed on
Nov 2, 1993
Sold by
Centex Real Estate
Bought by
Bogart Jeffrey J
Home Financials for this Owner
Home Financials are based on the most recent Mortgage that was taken out on this home.
Original Mortgage
$252,100
Interest Rate
6.86%
Create a Home Valuation Report for This Property
The Home Valuation Report is an in-depth analysis detailing your home's value as well as a comparison with similar homes in the area
Home Values in the Area
Average Home Value in this Area
Purchase History
| Date | Buyer | Sale Price | Title Company |
|---|---|---|---|
| Luongo John M | -- | None Available | |
| Luongo John M | -- | None Available | |
| Mccue Kathleen M | $380,000 | -- | |
| Bogart Jeffrey J | $280,145 | -- |
Source: Public Records
Mortgage History
| Date | Status | Borrower | Loan Amount |
|---|---|---|---|
| Previous Owner | Mccue Kathleen M | $304,000 | |
| Previous Owner | Bogart Jeffrey J | $252,100 |
Source: Public Records
Tax History Compared to Growth
Tax History
| Year | Tax Paid | Tax Assessment Tax Assessment Total Assessment is a certain percentage of the fair market value that is determined by local assessors to be the total taxable value of land and additions on the property. | Land | Improvement |
|---|---|---|---|---|
| 2025 | $9,469 | $882,240 | $390,000 | $492,240 |
| 2024 | $9,469 | $817,330 | $390,000 | $427,330 |
| 2023 | $9,625 | $852,940 | $390,000 | $462,940 |
| 2022 | $8,973 | $784,710 | $330,000 | $454,710 |
| 2021 | $8,704 | $741,750 | $300,000 | $441,750 |
| 2020 | $8,558 | $723,090 | $290,000 | $433,090 |
| 2019 | $8,174 | $690,630 | $270,000 | $420,630 |
| 2018 | $8,100 | $704,390 | $270,000 | $434,390 |
| 2017 | $7,858 | $676,830 | $255,000 | $421,830 |
| 2016 | $7,837 | $676,520 | $255,000 | $421,520 |
| 2015 | $7,357 | $659,240 | $250,000 | $409,240 |
| 2014 | $7,530 | $676,290 | $250,000 | $426,290 |
Source: Public Records
Map
Nearby Homes
- 2506 James Monroe Cir
- 2505 James Madison Cir
- 13438 Burrough Farm Dr
- 13210 Fox Ripple Ln
- 2522 Logan Wood Dr
- 13103 Anvil Place
- 2447 Clover Field Cir
- 13104 Meadow Hall Ct
- 2709 Floris Ln
- 13123 Copper Brook Way
- 2559 Peter Jefferson Ln
- 12901 Cedar Glen Ln
- 2492 Quick St Unit 103
- 3495 Audubon Cove
- 3499 Audubon Cove
- 13032 Monterey Estates Dr
- 2448 Rolling Plains Dr
- 13116 Marcey Creek Rd Unit 13116
- 2410 Dakota Lakes Dr
- 2546 James Maury Dr
- 13231 Stable Brook Way
- 13227 Stable Brook Way
- 13228 Stable Brook Way
- 13230 Stable Brook Way
- 13225 Stable Brook Way
- 13226 Stable Brook Way
- 13224 Stable Brook Way
- 13223 Stable Brook Way
- 2459 Iron Forge Rd
- 2460 Iron Forge Rd
- 2508 Silver Spur Ct
- 13221 Stable Brook Way
- 13222 Stable Brook Way
- 2461 Iron Forge Rd
- 2510 Silver Spur Ct
- 2462 Iron Forge Rd
- 13219 Stable Brook Way
- 13218 Stable Brook Way
- 2506 Silver Spur Ct
- 2463 Iron Forge Rd