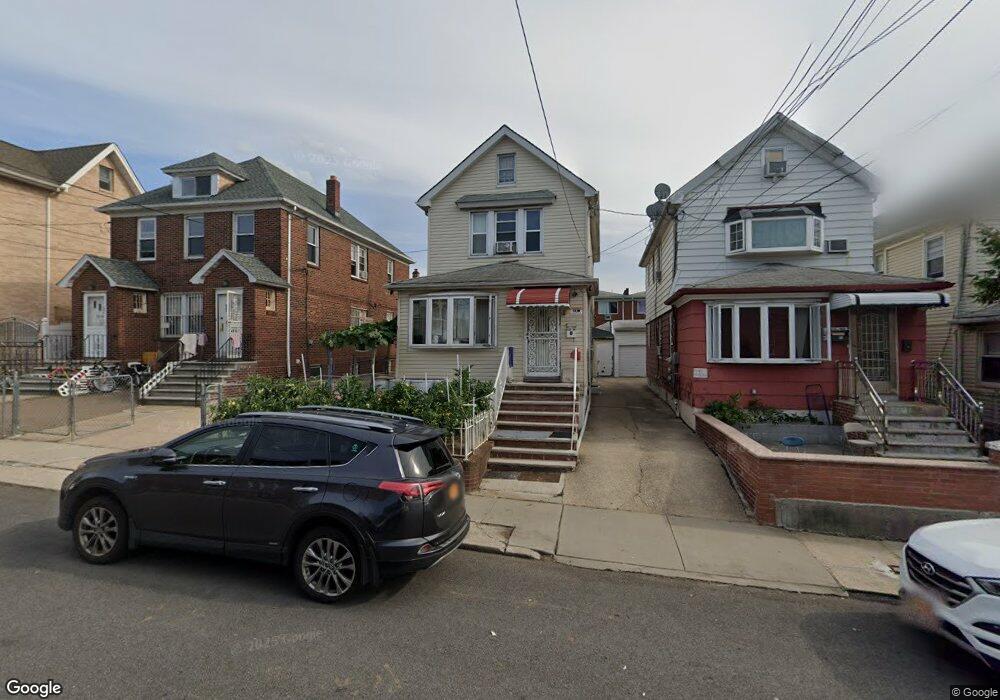
13234 58th Rd Flushing, NY 11355
Queensboro Hill NeighborhoodEstimated Value: $1,012,000 - $1,181,000
3
Beds
3
Baths
1,568
Sq Ft
$709/Sq Ft
Est. Value
About This Home
This home is located at 13234 58th Rd, Flushing, NY 11355 and is currently estimated at $1,112,137, approximately $709 per square foot. 13234 58th Rd is a home located in Queens County with nearby schools including P.S. 120 - Queens, Rachel Carson I.S. 237Q, and John Bowne High School.
Ownership History
Date
Name
Owned For
Owner Type
Purchase Details
Closed on
Nov 13, 2015
Sold by
Salto Vizhnay Enma N and Vizhnay Pablo I
Bought by
Shi Mujiao and Wang Yuyi
Current Estimated Value
Home Financials for this Owner
Home Financials are based on the most recent Mortgage that was taken out on this home.
Original Mortgage
$405,000
Outstanding Balance
$317,666
Interest Rate
3.87%
Mortgage Type
New Conventional
Estimated Equity
$794,471
Purchase Details
Closed on
Jul 27, 2007
Sold by
Zhang Xi Ming and Zhou Xiu Rong
Bought by
Salto Vizhnay Enma N and Vizhnay Pablo I
Home Financials for this Owner
Home Financials are based on the most recent Mortgage that was taken out on this home.
Original Mortgage
$484,000
Interest Rate
6.72%
Mortgage Type
Purchase Money Mortgage
Purchase Details
Closed on
Aug 20, 2002
Sold by
Fruda June
Bought by
Zhang Xi Ming and Zhou Xiu Rong
Home Financials for this Owner
Home Financials are based on the most recent Mortgage that was taken out on this home.
Original Mortgage
$170,000
Interest Rate
6.25%
Create a Home Valuation Report for This Property
The Home Valuation Report is an in-depth analysis detailing your home's value as well as a comparison with similar homes in the area
Home Values in the Area
Average Home Value in this Area
Purchase History
| Date | Buyer | Sale Price | Title Company |
|---|---|---|---|
| Shi Mujiao | $810,000 | -- | |
| Shi Mujiao | $810,000 | -- | |
| Salto Vizhnay Enma N | $605,000 | -- | |
| Salto Vizhnay Enma N | $605,000 | -- | |
| Zhang Xi Ming | -- | -- | |
| Zhang Xi Ming | -- | -- |
Source: Public Records
Mortgage History
| Date | Status | Borrower | Loan Amount |
|---|---|---|---|
| Open | Shi Mujiao | $405,000 | |
| Closed | Shi Mujiao | $405,000 | |
| Previous Owner | Salto Vizhnay Enma N | $484,000 | |
| Previous Owner | Zhang Xi Ming | $170,000 |
Source: Public Records
Tax History
| Year | Tax Paid | Tax Assessment Tax Assessment Total Assessment is a certain percentage of the fair market value that is determined by local assessors to be the total taxable value of land and additions on the property. | Land | Improvement |
|---|---|---|---|---|
| 2025 | $6,217 | $32,784 | $5,331 | $27,453 |
| 2024 | $6,217 | $30,954 | $5,381 | $25,573 |
| 2023 | $5,872 | $29,237 | $4,993 | $24,244 |
| 2022 | $4,184 | $56,760 | $11,640 | $45,120 |
| 2021 | $5,881 | $56,760 | $11,640 | $45,120 |
| 2020 | $5,756 | $56,160 | $11,640 | $44,520 |
| 2019 | $5,396 | $57,780 | $11,640 | $46,140 |
| 2018 | $4,967 | $24,364 | $5,252 | $19,112 |
| 2017 | $4,747 | $23,288 | $5,598 | $17,690 |
| 2016 | $4,655 | $23,288 | $5,598 | $17,690 |
| 2015 | $2,650 | $22,767 | $6,705 | $16,062 |
| 2014 | $2,650 | $21,496 | $7,601 | $13,895 |
Source: Public Records
Map
Nearby Homes
- 132-20 60th Ave
- 132-56 60th Ave
- 132-19 58th Ave
- 13437 58th Rd
- 13214 Horace Harding Expy
- 13006 58th Rd
- 130-14 60th Ave Unit 2E
- 5612 134th St
- 136-43 58th Rd
- 13620 Booth Memorial Ave Unit 2A
- 56-75 136th St Unit 3B
- 13506 62nd Rd
- 13814 58th Rd
- 55-15 134th St
- 135-15 63rd Ave
- 5804 Main St Unit 2D
- 13713 56th Ave
- 14017 58th Rd
- 61-12 Main St
- 6307 138th St
- 13234 58th Rd
- 13232 58th Rd
- 13232 58th Rd Unit 1st Fl
- 13232 58th Rd Unit 2 Fl
- 13232 58th Rd Unit 2
- 13232 58th Rd
- 13232 58th Rd Unit 2 Fl
- 13236 58th Rd Unit 1Fl
- 13236 58th Rd Unit 2Fl
- 13236 58th Rd
- 13236 58th Rd Unit 1FL+B
- 13236 58th Rd
- 13236 58th Rd Unit 1Fl
- 13236 58th Rd Unit 2Fl
- 13228 58th Rd
- 132-28 58th Rd
- 13240 58th Rd
- 13226 58th Rd
- 13226 58th Rd
- 13226 58th Rd
Your Personal Tour Guide
Ask me questions while you tour the home.