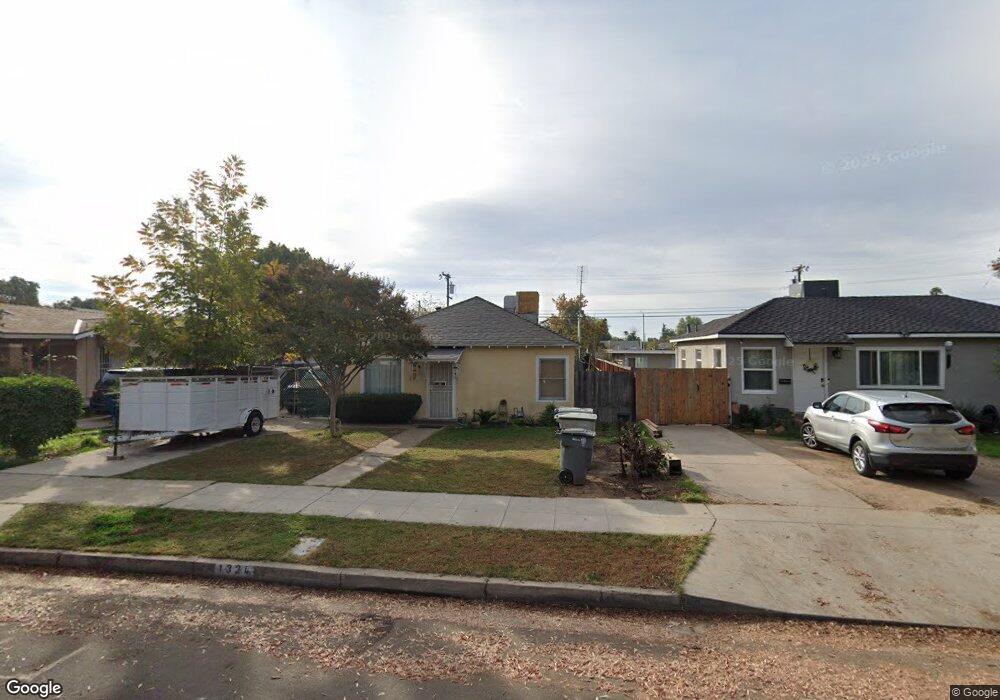
1324 E Andrews Ave Fresno, CA 93704
Maroa NeighborhoodEstimated Value: $234,000 - $282,000
2
Beds
1
Bath
1,144
Sq Ft
$225/Sq Ft
Est. Value
About This Home
This home is located at 1324 E Andrews Ave, Fresno, CA 93704 and is currently estimated at $257,265, approximately $224 per square foot. 1324 E Andrews Ave is a home located in Fresno County with nearby schools including Del Mar Elementary School, Fort Miller Middle School, and Fresno High School.
Ownership History
Date
Name
Owned For
Owner Type
Purchase Details
Closed on
Feb 22, 2011
Sold by
Parr Roland E
Bought by
Parr Roland E
Current Estimated Value
Home Financials for this Owner
Home Financials are based on the most recent Mortgage that was taken out on this home.
Original Mortgage
$57,500
Outstanding Balance
$39,140
Interest Rate
4.67%
Mortgage Type
New Conventional
Estimated Equity
$218,125
Purchase Details
Closed on
Jun 7, 2010
Sold by
Estes Jack
Bought by
Parr Roland E
Purchase Details
Closed on
Jan 16, 2010
Sold by
Estes Brenda A
Bought by
Estes Jack
Purchase Details
Closed on
Oct 24, 2008
Sold by
Parr Roland
Bought by
Estes Brenda A
Purchase Details
Closed on
Feb 11, 2005
Sold by
Estes Brenda A
Bought by
Parr Roland
Home Financials for this Owner
Home Financials are based on the most recent Mortgage that was taken out on this home.
Original Mortgage
$89,000
Interest Rate
5.79%
Mortgage Type
Seller Take Back
Create a Home Valuation Report for This Property
The Home Valuation Report is an in-depth analysis detailing your home's value as well as a comparison with similar homes in the area
Home Values in the Area
Average Home Value in this Area
Purchase History
| Date | Buyer | Sale Price | Title Company |
|---|---|---|---|
| Parr Roland E | -- | Placer Title Company | |
| Parr Roland E | -- | None Available | |
| Estes Jack | -- | None Available | |
| Estes Brenda A | -- | None Available | |
| Parr Roland | -- | North American Title Co Inc | |
| Parr Roland | $100,000 | North American Title Co Inc |
Source: Public Records
Mortgage History
| Date | Status | Borrower | Loan Amount |
|---|---|---|---|
| Open | Parr Roland E | $57,500 | |
| Previous Owner | Parr Roland | $89,000 |
Source: Public Records
Tax History Compared to Growth
Tax History
| Year | Tax Paid | Tax Assessment Tax Assessment Total Assessment is a certain percentage of the fair market value that is determined by local assessors to be the total taxable value of land and additions on the property. | Land | Improvement |
|---|---|---|---|---|
| 2025 | $619 | $45,283 | $9,769 | $35,514 |
| 2023 | $585 | $43,527 | $9,391 | $34,136 |
| 2022 | $578 | $42,674 | $9,207 | $33,467 |
| 2021 | $562 | $41,838 | $9,027 | $32,811 |
| 2020 | $560 | $41,410 | $8,935 | $32,475 |
| 2019 | $540 | $40,599 | $8,760 | $31,839 |
| 2018 | $528 | $39,804 | $8,589 | $31,215 |
| 2017 | $520 | $39,024 | $8,421 | $30,603 |
| 2016 | $504 | $38,259 | $8,256 | $30,003 |
| 2015 | $496 | $37,685 | $8,132 | $29,553 |
| 2014 | $485 | $36,948 | $7,973 | $28,975 |
Source: Public Records
Map
Nearby Homes
- 1442 E Shields Ave
- 1405 E Cortland Ave
- 1036 E Cornell Ave
- 3606 N College Ave
- 1329 E Princeton Ave
- 1305 E Fedora Ave
- 1007 E Michigan Ave
- 1346 E Princeton Ave
- 1134 E Princeton Ave
- 1126 E Princeton Ave
- 935 E Fedora Ave
- 1824 E Cornell Ave
- 964 E Princeton Ave
- 2026 E Simpson Ave
- 840 E Brown Ave
- 3734 N Abby St
- 1211 E Clinton Ave
- 1135 E Lansing Way
- 3640 N Van Ness Blvd
- 1212 E Saginaw Way
- 1332 E Andrews Ave
- 1316 E Andrews Ave
- 1331 E Shields Ave
- 1307 E Shields Ave
- 1348 E Andrews Ave
- 1339 E Shields Ave
- 1323 E Andrews Ave
- 1315 E Andrews Ave
- 1331 E Andrews Ave
- 1408 E Andrews Ave
- 1347 E Shields Ave Unit Rear
- 1347 E Shields Ave
- 1307 E Andrews Ave
- 3225 N Del Mar Ave
- 1339 E Andrews Ave
- 1247 E Shields Ave
- 1403 E Andrews Ave
- 1416 E Andrews Ave
- 1240 E Andrews Ave
- 1415 E Shields Ave