Estimated Value: $630,288 - $695,000
3
Beds
2
Baths
1,260
Sq Ft
$518/Sq Ft
Est. Value
About This Home
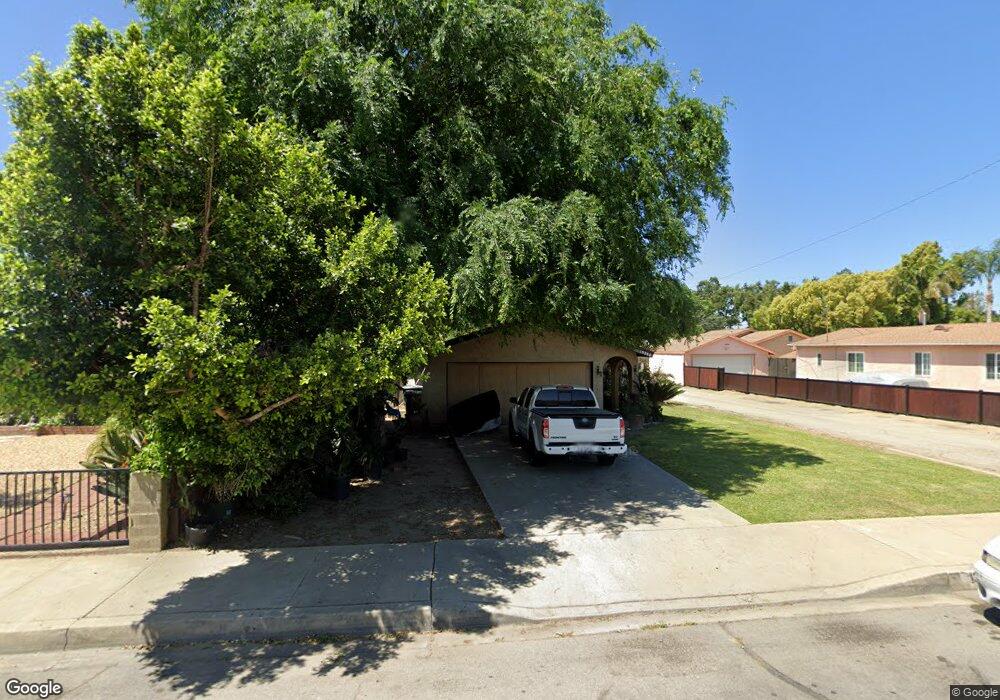
This home is located at 13248 2nd St, Chino, CA 91710 and is currently estimated at $652,072, approximately $517 per square foot. 13248 2nd St is a home located in San Bernardino County with nearby schools including Dickson Elementary, Ramona Junior High School, and Don Antonio Lugo High School.
Ownership History
Date
Name
Owned For
Owner Type
Purchase Details
Closed on
Apr 21, 2022
Sold by
Flores Cesar C
Bought by
Flores Cesar C and Miranda Elvia
Current Estimated Value
Purchase Details
Closed on
Apr 3, 2017
Sold by
Flores Cesar C
Bought by
Flores Cesar C
Home Financials for this Owner
Home Financials are based on the most recent Mortgage that was taken out on this home.
Original Mortgage
$315,425
Interest Rate
4.16%
Mortgage Type
FHA
Purchase Details
Closed on
Sep 19, 2006
Sold by
Flores Paula R
Bought by
Flores Cesar C
Home Financials for this Owner
Home Financials are based on the most recent Mortgage that was taken out on this home.
Original Mortgage
$292,500
Interest Rate
8.97%
Mortgage Type
Purchase Money Mortgage
Purchase Details
Closed on
Nov 14, 1997
Sold by
Paredes Francisco G
Bought by
Gonzales Robert
Create a Home Valuation Report for This Property
The Home Valuation Report is an in-depth analysis detailing your home's value as well as a comparison with similar homes in the area
Home Values in the Area
Average Home Value in this Area
Purchase History
| Date | Buyer | Sale Price | Title Company |
|---|---|---|---|
| Flores Cesar C | -- | Anzures Ivonne | |
| Flores Cesar C | -- | Wfg National Title | |
| Flores Cesar C | -- | Investors Title Company | |
| Gonzales Robert | -- | -- |
Source: Public Records
Mortgage History
| Date | Status | Borrower | Loan Amount |
|---|---|---|---|
| Previous Owner | Flores Cesar C | $315,425 | |
| Previous Owner | Flores Cesar C | $292,500 |
Source: Public Records
Tax History Compared to Growth
Tax History
| Year | Tax Paid | Tax Assessment Tax Assessment Total Assessment is a certain percentage of the fair market value that is determined by local assessors to be the total taxable value of land and additions on the property. | Land | Improvement |
|---|---|---|---|---|
| 2025 | $1,890 | $172,266 | $38,281 | $133,985 |
| 2024 | $1,890 | $168,888 | $37,530 | $131,358 |
| 2023 | $1,838 | $165,576 | $36,794 | $128,782 |
| 2022 | $1,750 | $162,330 | $36,073 | $126,257 |
| 2021 | $1,714 | $159,147 | $35,366 | $123,781 |
| 2020 | $1,691 | $157,515 | $35,003 | $122,512 |
| 2019 | $1,661 | $154,427 | $34,317 | $120,110 |
| 2018 | $1,623 | $151,399 | $33,644 | $117,755 |
| 2017 | $1,592 | $148,430 | $32,984 | $115,446 |
| 2016 | $1,488 | $145,519 | $32,337 | $113,182 |
| 2015 | $1,457 | $143,333 | $31,851 | $111,482 |
| 2014 | $1,427 | $140,525 | $31,227 | $109,298 |
Source: Public Records
Map
Nearby Homes
- 13123 2nd St
- 13115 Monte Vista Ave
- 4912 G St
- 4825 Ranch Rd
- 4621 Chino Ave
- 4814 Ranch Rd
- 12951 Royal Palm Cir
- 12905 Saddleback Place
- 13139 Derby Ave
- 4524 Carmen St
- 13401 Wisteria Place
- 0 C St
- 13232 Yorkers Place Unit C
- 4755 Gettysburg Ave
- 12958 Boston Ave
- 12835 10th St Unit 23
- 12835 10th St Unit 56
- 12836 12th St Unit 27
- 12635 Franklin Ct Unit 8b
- 13185 14th St
- 13258 2nd St
- 13240 2nd St
- 13264 2nd St
- 13232 2nd St
- 13272 2nd St
- 13267 Monte Vista Ave
- 13247 Monte Vista Ave
- 13239 Monte Vista Ave
- 13224 2nd St
- 13275 Monte Vista Ave
- 13231 Monte Vista Ave
- 13280 2nd St
- 13216 2nd St
- 13247 2nd St
- 13257 2nd St
- 13223 Monte Vista Ave Unit B
- 13223 Monte Vista Ave
- 13239 2nd St
- 13286 2nd St
- 13263 2nd St