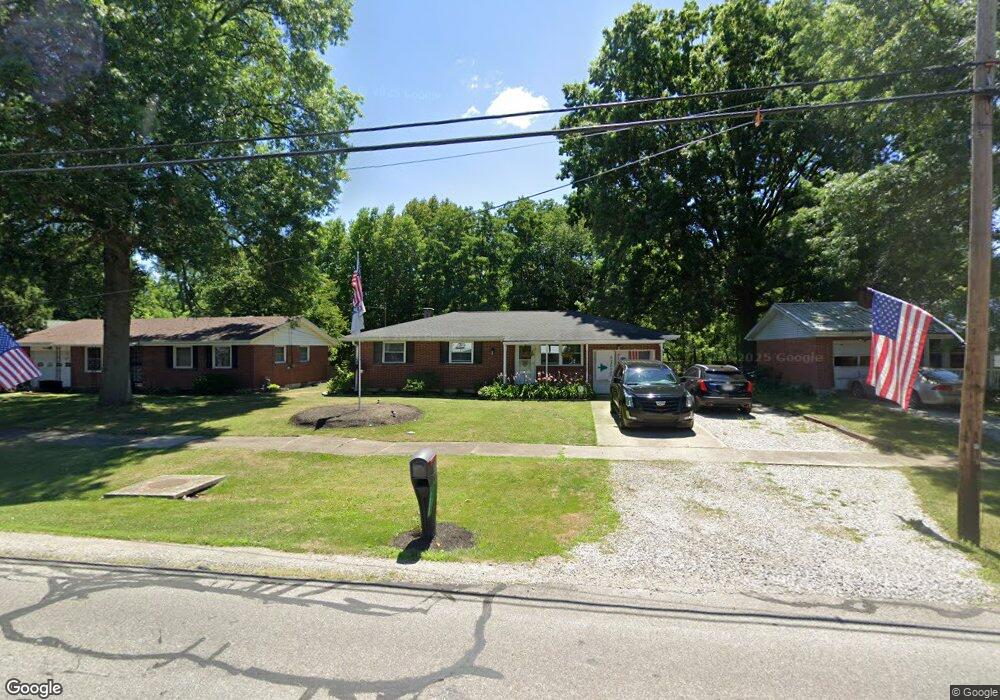
1325 Orange Rd Ashland, OH 44805
Estimated Value: $158,000 - $191,000
3
Beds
2
Baths
1,026
Sq Ft
$165/Sq Ft
Est. Value
About This Home
This home is located at 1325 Orange Rd, Ashland, OH 44805 and is currently estimated at $169,145, approximately $164 per square foot. 1325 Orange Rd is a home located in Ashland County with nearby schools including Ashland High School and Ashland Christian Elementary School.
Ownership History
Date
Name
Owned For
Owner Type
Purchase Details
Closed on
Jul 11, 2016
Sold by
Grindle Myrtle A
Bought by
Tock Kenneth and Tock Mary
Current Estimated Value
Home Financials for this Owner
Home Financials are based on the most recent Mortgage that was taken out on this home.
Original Mortgage
$32,000
Outstanding Balance
$14,500
Interest Rate
3.56%
Mortgage Type
New Conventional
Estimated Equity
$154,645
Purchase Details
Closed on
Jan 1, 1990
Bought by
Grindle Myrtle A
Create a Home Valuation Report for This Property
The Home Valuation Report is an in-depth analysis detailing your home's value as well as a comparison with similar homes in the area
Home Values in the Area
Average Home Value in this Area
Purchase History
| Date | Buyer | Sale Price | Title Company |
|---|---|---|---|
| Tock Kenneth | $40,000 | Barrister Title | |
| Grindle Myrtle A | -- | -- |
Source: Public Records
Mortgage History
| Date | Status | Borrower | Loan Amount |
|---|---|---|---|
| Open | Tock Kenneth | $32,000 |
Source: Public Records
Tax History Compared to Growth
Tax History
| Year | Tax Paid | Tax Assessment Tax Assessment Total Assessment is a certain percentage of the fair market value that is determined by local assessors to be the total taxable value of land and additions on the property. | Land | Improvement |
|---|---|---|---|---|
| 2024 | $1,393 | $39,290 | $6,190 | $33,100 |
| 2023 | $1,393 | $39,290 | $6,190 | $33,100 |
| 2022 | $1,354 | $30,220 | $4,760 | $25,460 |
| 2021 | $1,359 | $30,220 | $4,760 | $25,460 |
| 2020 | $1,289 | $30,220 | $4,760 | $25,460 |
| 2019 | $1,115 | $24,170 | $4,950 | $19,220 |
| 2018 | $1,125 | $24,170 | $4,950 | $19,220 |
| 2017 | $1,027 | $24,170 | $4,950 | $19,220 |
| 2016 | $1,027 | $21,030 | $4,310 | $16,720 |
| 2015 | $1,018 | $21,030 | $4,310 | $16,720 |
| 2013 | $1,345 | $26,060 | $4,360 | $21,700 |
Source: Public Records
Map
Nearby Homes