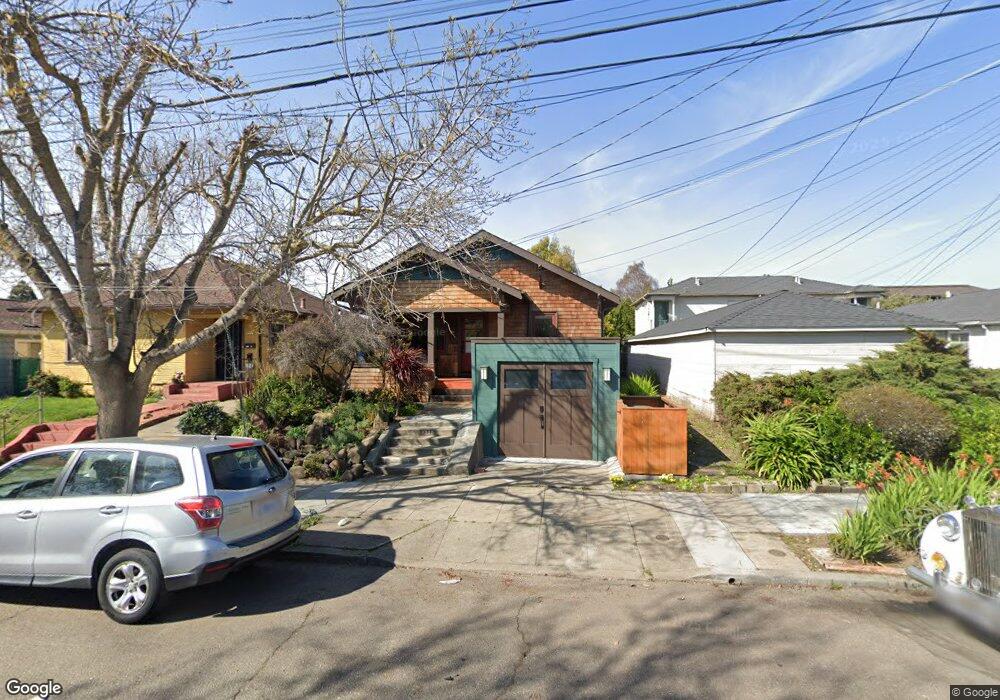
1325 Parker St Berkeley, CA 94702
West Berkeley NeighborhoodEstimated Value: $1,263,000 - $1,415,374
3
Beds
1
Bath
1,196
Sq Ft
$1,141/Sq Ft
Est. Value
About This Home
This home is located at 1325 Parker St, Berkeley, CA 94702 and is currently estimated at $1,364,094, approximately $1,140 per square foot. 1325 Parker St is a home located in Alameda County with nearby schools including Oxford Elementary School, Washington Elementary School, and Malcolm X Elementary School.
Ownership History
Date
Name
Owned For
Owner Type
Purchase Details
Closed on
Aug 12, 2014
Sold by
Wemer Gavin and Lindow Megan
Bought by
Jeffers Emily and Jones Rachel
Current Estimated Value
Home Financials for this Owner
Home Financials are based on the most recent Mortgage that was taken out on this home.
Original Mortgage
$560,000
Outstanding Balance
$427,158
Interest Rate
4.12%
Mortgage Type
New Conventional
Estimated Equity
$936,936
Purchase Details
Closed on
Dec 17, 2001
Sold by
Mandel Mischelle J
Bought by
Werner Gavin C and Lindow Megan J
Home Financials for this Owner
Home Financials are based on the most recent Mortgage that was taken out on this home.
Original Mortgage
$275,000
Interest Rate
6.51%
Purchase Details
Closed on
Aug 24, 1995
Sold by
Mandel Mischelle J and Maveety Mischelle J
Bought by
Mandel Mischelle J
Create a Home Valuation Report for This Property
The Home Valuation Report is an in-depth analysis detailing your home's value as well as a comparison with similar homes in the area
Home Values in the Area
Average Home Value in this Area
Purchase History
| Date | Buyer | Sale Price | Title Company |
|---|---|---|---|
| Jeffers Emily | $710,000 | Chicago Title Company | |
| Werner Gavin C | $405,000 | First American Title Guarant | |
| Mandel Mischelle J | $1,000 | Fidelity National Title |
Source: Public Records
Mortgage History
| Date | Status | Borrower | Loan Amount |
|---|---|---|---|
| Open | Jeffers Emily | $560,000 | |
| Previous Owner | Werner Gavin C | $275,000 |
Source: Public Records
Tax History
| Year | Tax Paid | Tax Assessment Tax Assessment Total Assessment is a certain percentage of the fair market value that is determined by local assessors to be the total taxable value of land and additions on the property. | Land | Improvement |
|---|---|---|---|---|
| 2025 | $12,310 | $946,284 | $255,985 | $697,299 |
| 2024 | $12,310 | $829,557 | $250,967 | $585,590 |
| 2023 | $11,494 | $820,155 | $246,046 | $574,109 |
| 2022 | $11,320 | $797,074 | $241,222 | $562,852 |
| 2021 | $11,364 | $781,312 | $236,493 | $551,819 |
| 2020 | $10,849 | $780,232 | $234,069 | $546,163 |
| 2019 | $10,522 | $764,938 | $229,481 | $535,457 |
| 2018 | $10,365 | $749,944 | $224,983 | $524,961 |
| 2017 | $10,013 | $735,240 | $220,572 | $514,668 |
| 2016 | $9,825 | $720,827 | $216,248 | $504,579 |
| 2015 | $9,706 | $710,000 | $213,000 | $497,000 |
| 2014 | $7,076 | $488,057 | $146,417 | $341,640 |
Source: Public Records
Map
Nearby Homes
- 1142 Dwight Way
- 1118 Dwight Way
- 1515 Derby St
- 1450 Ward St
- 2750 Sacramento St
- 2758 Sacramento St
- 2774 Sacramento St
- 2782 Sacramento St
- 2790 Sacramento St
- 2324 Browning St
- 1092 Dwight Way
- 2751 Wallace St
- 1612 Parker St
- 1612 Carleton St
- 2747 San Pablo Ave Unit 507
- 1530 Stuart St
- 1034 Grayson St
- 1039 Channing Way
- 1645 Dwight Way
- 1010 Grayson St
- 1329 Parker St Unit 1329
- 1321 Parker St
- 1327 Parker St Unit 1327 Parker St Apt A
- 1319 Parker St
- 1333 Parker St
- 1317 Parker St
- 1326 Blake St
- 1328 Blake St
- 1339 Parker St
- 1332 Blake St
- 1322 Blake St
- 1313 Parker St
- 1334 Blake St
- 1318 Blake St
- 1334 Parker St
- 1343 Parker St
- 1326 Parker St
- 1328 Parker St
- 1316 Blake St
- 1336 Blake St
Your Personal Tour Guide
Ask me questions while you tour the home.