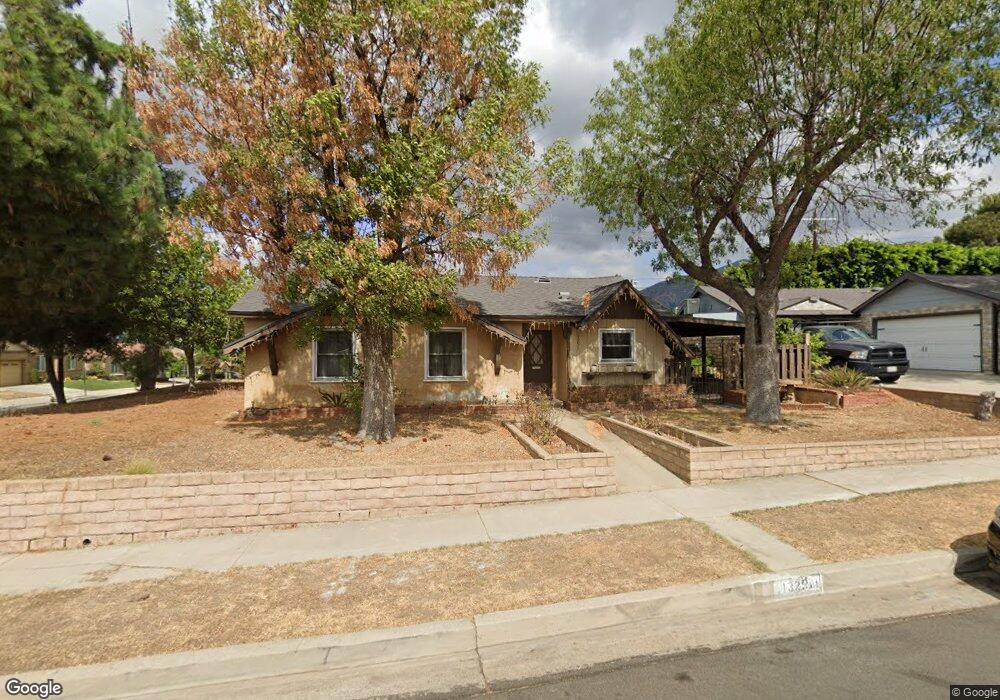
13251 Leach St Sylmar, CA 91342
Estimated Value: $758,870 - $952,000
3
Beds
2
Baths
1,382
Sq Ft
$637/Sq Ft
Est. Value
About This Home
This home is located at 13251 Leach St, Sylmar, CA 91342 and is currently estimated at $880,718, approximately $637 per square foot. 13251 Leach St is a home located in Los Angeles County with nearby schools including Olive Vista Middle School, San Fernando Senior High School, and PUC Community Charter Elementary School.
Ownership History
Date
Name
Owned For
Owner Type
Purchase Details
Closed on
Jun 10, 2010
Sold by
Ritzo Lisa M
Bought by
Ritzo Lisa
Current Estimated Value
Home Financials for this Owner
Home Financials are based on the most recent Mortgage that was taken out on this home.
Original Mortgage
$252,000
Outstanding Balance
$169,057
Interest Rate
4.99%
Mortgage Type
New Conventional
Estimated Equity
$711,661
Purchase Details
Closed on
Jan 8, 1998
Sold by
World Svgs Bank
Bought by
Ritzo Lisa M
Home Financials for this Owner
Home Financials are based on the most recent Mortgage that was taken out on this home.
Original Mortgage
$118,000
Interest Rate
9.12%
Purchase Details
Closed on
Aug 22, 1997
Sold by
Mounce Karen Lee and World Svgs Bank Fsb
Bought by
World Svgs Bank Fsb
Create a Home Valuation Report for This Property
The Home Valuation Report is an in-depth analysis detailing your home's value as well as a comparison with similar homes in the area
Home Values in the Area
Average Home Value in this Area
Purchase History
| Date | Buyer | Sale Price | Title Company |
|---|---|---|---|
| Ritzo Lisa | -- | Lawyers Title | |
| Ritzo Lisa M | $147,500 | Fidelity Title | |
| World Svgs Bank Fsb | $152,671 | Stewart Title |
Source: Public Records
Mortgage History
| Date | Status | Borrower | Loan Amount |
|---|---|---|---|
| Open | Ritzo Lisa | $252,000 | |
| Closed | Ritzo Lisa M | $118,000 |
Source: Public Records
Tax History Compared to Growth
Tax History
| Year | Tax Paid | Tax Assessment Tax Assessment Total Assessment is a certain percentage of the fair market value that is determined by local assessors to be the total taxable value of land and additions on the property. | Land | Improvement |
|---|---|---|---|---|
| 2025 | $3,046 | $235,492 | $80,462 | $155,030 |
| 2024 | $3,046 | $230,876 | $78,885 | $151,991 |
| 2023 | $2,991 | $226,350 | $77,339 | $149,011 |
| 2022 | $2,860 | $221,913 | $75,823 | $146,090 |
| 2021 | $2,819 | $217,563 | $74,337 | $143,226 |
| 2019 | $2,738 | $211,112 | $72,133 | $138,979 |
| 2018 | $2,644 | $206,973 | $70,719 | $136,254 |
| 2016 | $2,516 | $198,938 | $67,974 | $130,964 |
| 2015 | $2,481 | $195,950 | $66,953 | $128,997 |
| 2014 | $2,496 | $192,113 | $65,642 | $126,471 |
Source: Public Records
Map
Nearby Homes
- 13197 Leach St
- 13148 Gladstone Ave
- 13372 Hyland Ct
- 13475 Hubbard St Unit 31
- 13247 Tripoli Ave
- 13540 Hubbard St Unit 21
- 12888 Four Palms Ln
- 13912 N Mesa Alta Rd
- 13550 Foothill Blvd Unit 27
- 13427 Beaver St
- 13384 Foothill Blvd
- 13414 Herron St
- 12745 N Watt Ln Unit B
- 12745 N Watt Ln Unit A
- 12745 N Watt Ln Unit B
- 12826 Bromont Ave
- 12940 Harding St
- 13441 Fenton Ave
- 13750 Hubbard St Unit 77
- 13219 Shaw Ln
- 13160 Wheeler Ave
- 13239 Leach St
- 13138 Wheeler Ave
- 13166 Wheeler Ave
- 13151 Wheeler Ave
- 13157 Wheeler Ave
- 13201 Azores Ave
- 13231 Leach St
- 13172 Wheeler Ave
- 13236 Leach St
- 13130 Wheeler Ave
- 13163 Wheeler Ave
- 13205 Azores Ave
- 13136 Vista View Cir
- 13149 Wheeler Ave
- 13200 Azores Ave
- 13223 Leach St
- 13178 Wheeler Ave
- 13228 Leach St
- 13169 Wheeler Ave