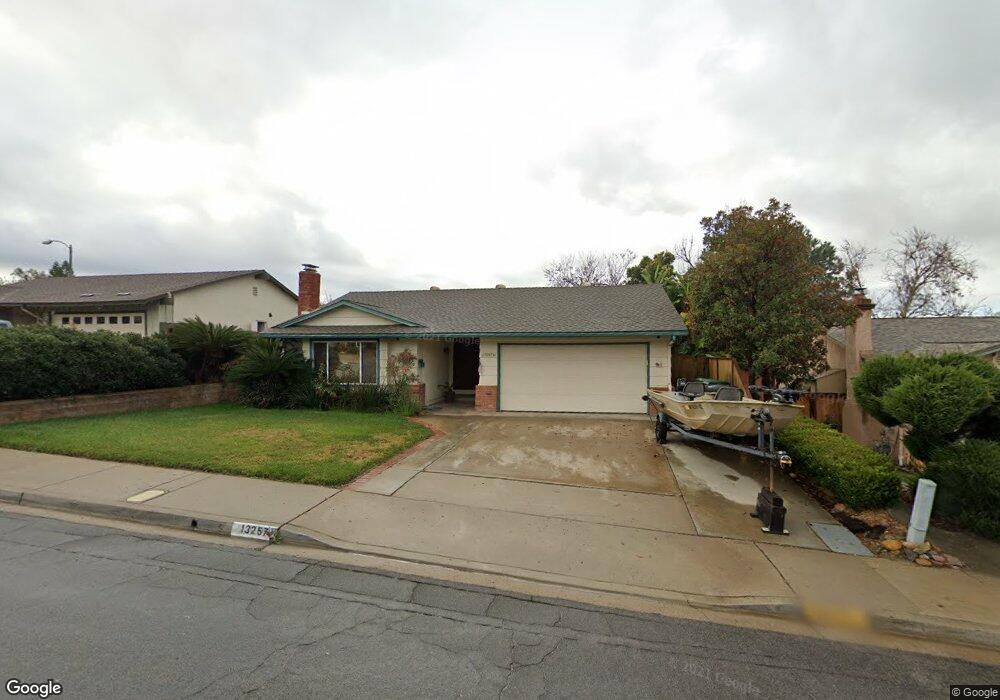
13257 Laurel St Lakeside, CA 92040
Estimated Value: $683,000 - $798,000
4
Beds
2
Baths
1,449
Sq Ft
$527/Sq Ft
Est. Value
About This Home
This home is located at 13257 Laurel St, Lakeside, CA 92040 and is currently estimated at $763,113, approximately $526 per square foot. 13257 Laurel St is a home located in San Diego County with nearby schools including Lindo Park Elementary School, Tierra Del Sol Middle School, and El Capitan High School.
Ownership History
Date
Name
Owned For
Owner Type
Purchase Details
Closed on
Mar 25, 2024
Sold by
Dennis And Sharon Carson Family Trust
Bought by
Stevens Reginald William and Stevens Christine
Current Estimated Value
Home Financials for this Owner
Home Financials are based on the most recent Mortgage that was taken out on this home.
Original Mortgage
$726,750
Outstanding Balance
$714,977
Interest Rate
6.77%
Mortgage Type
New Conventional
Estimated Equity
$48,136
Purchase Details
Closed on
Aug 19, 2009
Sold by
Carson Dennis V
Bought by
Carson Dennis and The Dennis & Sharon Carson Family Trust
Home Financials for this Owner
Home Financials are based on the most recent Mortgage that was taken out on this home.
Original Mortgage
$150,000
Interest Rate
5.09%
Mortgage Type
New Conventional
Purchase Details
Closed on
Jan 16, 2002
Sold by
Carson Dennis V and Carson Sharon K
Bought by
Carson Dennis and Carson Sharon K
Create a Home Valuation Report for This Property
The Home Valuation Report is an in-depth analysis detailing your home's value as well as a comparison with similar homes in the area
Purchase History
We collect this data history from publicly available records. To have your information removed, we recommend requesting removal directly through your county’s website.
| Date | Buyer | Sale Price | Title Company |
|---|---|---|---|
| Stevens Reginald William | $765,000 | None Listed On Document | |
| Carson Dennis | -- | Chicago Title Company | |
| Carson Dennis | -- | -- |
Source: Public Records
Mortgage History
We collect this data history from publicly available records. To have your information removed, we recommend requesting removal directly through your county’s website.
| Date | Status | Borrower | Loan Amount |
|---|---|---|---|
| Open | Stevens Reginald William | $726,750 | |
| Previous Owner | Carson Dennis | $150,000 |
Source: Public Records
Tax History
| Year | Tax Paid | Tax Assessment Tax Assessment Total Assessment is a certain percentage of the fair market value that is determined by local assessors to be the total taxable value of land and additions on the property. | Land | Improvement |
|---|---|---|---|---|
| 2025 | $1,532 | $780,299 | $183,124 | $597,175 |
| 2024 | $1,532 | $67,435 | $15,826 | $51,609 |
| 2023 | $1,467 | $66,114 | $15,516 | $50,598 |
| 2022 | $1,420 | $64,818 | $15,212 | $49,606 |
| 2021 | $1,410 | $63,548 | $14,914 | $48,634 |
| 2020 | $1,361 | $62,898 | $14,762 | $48,136 |
| 2019 | $1,336 | $61,666 | $14,473 | $47,193 |
| 2018 | $1,275 | $60,458 | $14,190 | $46,268 |
| 2017 | $822 | $59,273 | $13,912 | $45,361 |
| 2016 | $1,081 | $58,112 | $13,640 | $44,472 |
| 2015 | $1,069 | $57,240 | $13,436 | $43,804 |
| 2014 | $1,036 | $56,119 | $13,173 | $42,946 |
Source: Public Records
Map
Nearby Homes
- 13238 Beechtree St
- 9909 Winchester Way
- 13314 Lakeshore Dr
- 9902 Saddleback Dr
- 13107 Pam Ln
- 13035 Laurel St
- 9747 Lakeview Rd
- 12923 Mapleview St Unit 6
- 13055 Lindo Ln
- 12805 18 Mapleview
- 12830 Mapleview St
- 9903 Lindo Lake Place
- 9622 Lakeview Rd
- 12741 Laurel St Unit 34
- 12828 Mapleview St
- 12710 Laurel St Unit 113
- 12730 Laurel St Unit 302
- 12728 Lakeshore Dr Unit A
- 12750 Laurel St Unit 504
- 12650 Lakeshore Dr Unit 165
- 13263 Laurel St
- 13251 Laurel St
- 10040 Orcas Way
- 13245 Laurel St
- 10034 Orcas Way
- 13256 Laurel St
- 13239 Laurel St
- 13262 Laurel St
- 13250 Laurel St
- 13301 Laurel St
- 13268 Laurel St
- 13244 Laurel St
- 10028 Orcas Way
- 10035 Orcas Way
- 13302 Laurel St
- 13233 Laurel St
- 13228 Laurel St
- 13305 Laurel St
- 10041 Orcas Way
- 13227 Laurel St
Your Personal Tour Guide
Ask me questions while you tour the home.