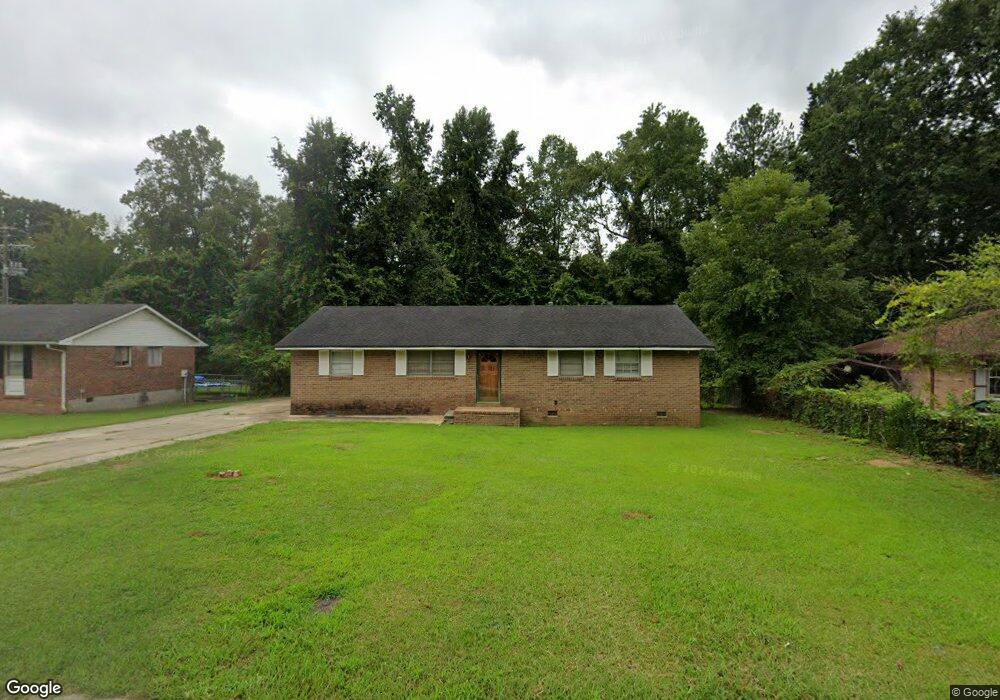
1326 Hatchcover Cir Jonesboro, GA 30238
Estimated Value: $166,000 - $219,000
4
Beds
1
Bath
1,352
Sq Ft
$144/Sq Ft
Est. Value
About This Home
This home is located at 1326 Hatchcover Cir, Jonesboro, GA 30238 and is currently estimated at $194,389, approximately $143 per square foot. 1326 Hatchcover Cir is a home located in Clayton County with nearby schools including Hawthorne Elementary School, Mundys Mill Middle School, and Lovejoy High School.
Ownership History
Date
Name
Owned For
Owner Type
Purchase Details
Closed on
Dec 12, 2008
Sold by
Cwabs Inc Series 2006-11
Bought by
Huynh Hanh T T
Current Estimated Value
Purchase Details
Closed on
Oct 7, 2008
Sold by
Thompson Israel
Bought by
Cwabs Inc Series 2006-11
Purchase Details
Closed on
May 12, 2006
Sold by
Hall William
Bought by
Thompson Isreal
Home Financials for this Owner
Home Financials are based on the most recent Mortgage that was taken out on this home.
Original Mortgage
$119,700
Interest Rate
10.55%
Mortgage Type
New Conventional
Purchase Details
Closed on
Feb 16, 2006
Sold by
Jpmorgan Chase Bank
Bought by
Hall William
Home Financials for this Owner
Home Financials are based on the most recent Mortgage that was taken out on this home.
Original Mortgage
$73,444
Interest Rate
6.08%
Mortgage Type
New Conventional
Purchase Details
Closed on
Jun 7, 2005
Sold by
Hackworth Herman E and Hackworth Mildred
Bought by
Jp Morgan Chase Bk
Create a Home Valuation Report for This Property
The Home Valuation Report is an in-depth analysis detailing your home's value as well as a comparison with similar homes in the area
Home Values in the Area
Average Home Value in this Area
Purchase History
| Date | Buyer | Sale Price | Title Company |
|---|---|---|---|
| Huynh Hanh T T | $21,000 | -- | |
| Cwabs Inc Series 2006-11 | $38,250 | -- | |
| Thompson Isreal | $126,000 | -- | |
| Hall William | -- | -- | |
| Jp Morgan Chase Bk | $85,385 | -- |
Source: Public Records
Mortgage History
| Date | Status | Borrower | Loan Amount |
|---|---|---|---|
| Previous Owner | Thompson Isreal | $119,700 | |
| Previous Owner | Hall William | $73,444 |
Source: Public Records
Tax History Compared to Growth
Tax History
| Year | Tax Paid | Tax Assessment Tax Assessment Total Assessment is a certain percentage of the fair market value that is determined by local assessors to be the total taxable value of land and additions on the property. | Land | Improvement |
|---|---|---|---|---|
| 2024 | $2,484 | $63,680 | $7,200 | $56,480 |
| 2023 | $2,305 | $63,840 | $7,200 | $56,640 |
| 2022 | $2,003 | $51,040 | $7,200 | $43,840 |
| 2021 | $1,398 | $35,400 | $7,200 | $28,200 |
| 2020 | $1,232 | $30,806 | $7,200 | $23,606 |
| 2019 | $1,143 | $28,147 | $6,400 | $21,747 |
| 2018 | $1,007 | $24,804 | $6,400 | $18,404 |
| 2017 | $920 | $22,599 | $6,400 | $16,199 |
| 2016 | $846 | $20,796 | $8,000 | $12,796 |
| 2015 | $832 | $0 | $0 | $0 |
| 2014 | $703 | $20,796 | $8,000 | $12,796 |
Source: Public Records
Map
Nearby Homes
- 1352 Labelle St
- 10085 Brass Ring Rd
- 1147 Dunivin Dr
- 10248 Briarbay Loop
- 1296 Todiway Ct
- 1485 Bola Ct
- 10065 Brass Ring Rd
- 1253 Todiway Ct
- 1892 Old Dogwood
- 1544 Iris Walk
- 1560 Iris Walk
- 1565 Iris Walk
- 1970 Old Dogwood
- 1241 Larkwood Dr
- 10197 Hamilton Glen
- 1478 Interlaken Pass
- 1597 Iris Walk
- 1342 Winslow Dr
- The Ryman Plan at Trellis Park
- The Benson II Plan at Trellis Park
- 1320 Hatchcover Cir
- 1332 Hatchcover Cir Unit 1
- 1406 Iron Gate Blvd Unit I
- 1364 Labelle St
- 1338 Hatchcover Cir
- 1327 Hatchcover Cir
- 1358 Labelle St
- 1372 Labelle St
- 1321 Hatchcover Cir
- 1333 Hatchcover Cir Unit 1
- 1344 Hatchcover Cir
- 1339 Hatchcover Cir
- 1415 Iron Gate Blvd
- 1409 Iron Gate Blvd
- 1346 Labelle St Unit 44
- 1346 Labelle St
- 1345 Hatchcover Cir Unit 1
- 1403 Iron Gate Blvd Unit 1
- 1350 Hatchcover Cir
- 1427 Iron Gate Blvd