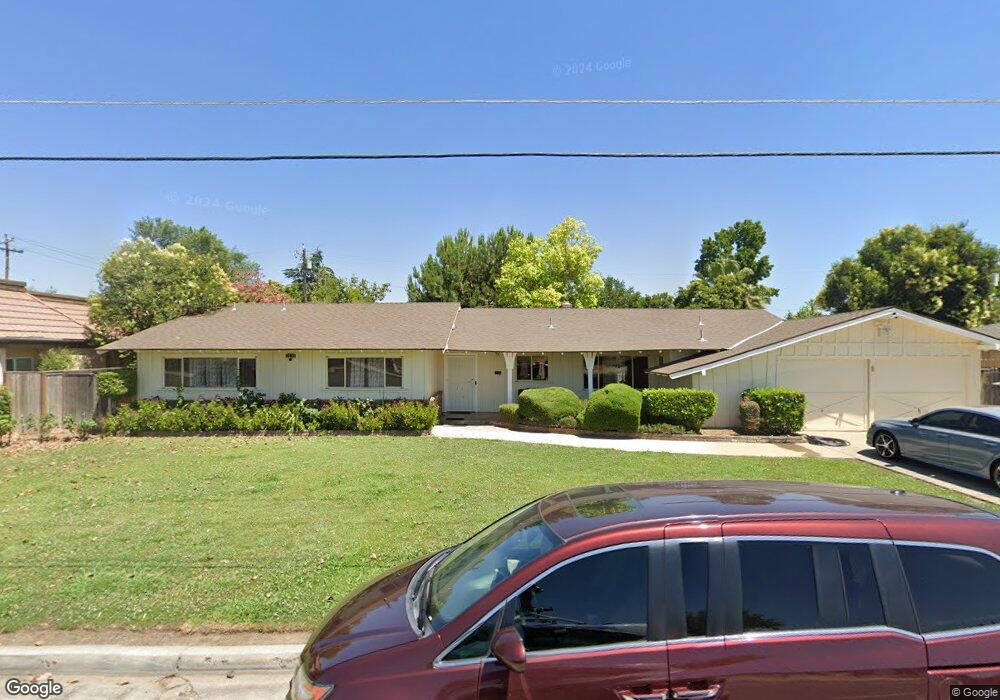
1327 E Ashlan Ave Fresno, CA 93704
Fig Garden NeighborhoodEstimated Value: $369,000 - $441,000
3
Beds
3
Baths
2,078
Sq Ft
$195/Sq Ft
Est. Value
About This Home
This home is located at 1327 E Ashlan Ave, Fresno, CA 93704 and is currently estimated at $405,012, approximately $194 per square foot. 1327 E Ashlan Ave is a home located in Fresno County with nearby schools including Powers-Ginsburg Elementary, Bullard High School, and Aspen Meadow Public School.
Ownership History
Date
Name
Owned For
Owner Type
Purchase Details
Closed on
Jul 15, 2016
Sold by
Woo Darren C and Hiebert Trudy
Bought by
Terrace Properties Dt Llc
Current Estimated Value
Purchase Details
Closed on
Mar 28, 2013
Sold by
Woo Conway K W
Bought by
Woo Darren C
Home Financials for this Owner
Home Financials are based on the most recent Mortgage that was taken out on this home.
Original Mortgage
$74,000
Interest Rate
2.74%
Mortgage Type
New Conventional
Purchase Details
Closed on
Mar 19, 2013
Sold by
Woo Conway K W
Bought by
Woo Conway K W
Home Financials for this Owner
Home Financials are based on the most recent Mortgage that was taken out on this home.
Original Mortgage
$74,000
Interest Rate
2.74%
Mortgage Type
New Conventional
Purchase Details
Closed on
Mar 7, 2003
Sold by
Woo Jack P
Bought by
Woo Jack P
Create a Home Valuation Report for This Property
The Home Valuation Report is an in-depth analysis detailing your home's value as well as a comparison with similar homes in the area
Home Values in the Area
Average Home Value in this Area
Purchase History
| Date | Buyer | Sale Price | Title Company |
|---|---|---|---|
| Terrace Properties Dt Llc | -- | None Available | |
| Woo Darren C | -- | None Available | |
| Woo Darren C | $128,000 | Fidelity National Title Co | |
| Woo Darren C | -- | Fidelity National Title Co | |
| Woo Conway K W | -- | None Available | |
| Woo Jack P | -- | -- |
Source: Public Records
Mortgage History
| Date | Status | Borrower | Loan Amount |
|---|---|---|---|
| Previous Owner | Woo Darren C | $74,000 |
Source: Public Records
Tax History Compared to Growth
Tax History
| Year | Tax Paid | Tax Assessment Tax Assessment Total Assessment is a certain percentage of the fair market value that is determined by local assessors to be the total taxable value of land and additions on the property. | Land | Improvement |
|---|---|---|---|---|
| 2025 | $1,344 | $108,293 | $18,911 | $89,382 |
| 2023 | $1,319 | $104,090 | $18,178 | $85,912 |
| 2022 | $1,301 | $102,050 | $17,822 | $84,228 |
| 2021 | $1,266 | $100,050 | $17,473 | $82,577 |
| 2020 | $1,261 | $99,025 | $17,294 | $81,731 |
| 2019 | $1,213 | $97,084 | $16,955 | $80,129 |
| 2018 | $1,187 | $95,181 | $16,623 | $78,558 |
| 2017 | $1,167 | $93,316 | $16,298 | $77,018 |
| 2016 | $1,128 | $91,487 | $15,979 | $75,508 |
| 2015 | $1,112 | $90,113 | $15,739 | $74,374 |
| 2014 | $1,089 | $88,349 | $15,431 | $72,918 |
Source: Public Records
Map
Nearby Homes
- 1444 E Swift Ave
- 1408 E Richert Ave
- 4355 N College Ave
- 1403 E Griffith Way
- 4434 N Blackstone Ave
- 1020 E Saginaw Way
- 1448 E Gettysburg Ave
- 825 E Indianapolis Ave
- 4617 N Glenn Ave
- 1911 E Saginaw Way
- 1216 E Pico Ave
- 4633 N Glenn Ave
- 1898 E Gettysburg Ave Unit 107
- 4175 N Van Ness Blvd
- 1438 E Rialto Ave
- 4136 N Thesta St
- 4136 N Thesta St Unit 36
- 2316 E Hampton Way
- 2326 E Hampton Way
- 2018 E Pico Ave
- 1313 E Ashlan Ave
- 1313 E Ashlan Ave Unit A,B,C
- 1345 E Ashlan Ave
- 1330 E Austin Way
- 1312 E Austin Way
- 1348 E Austin Way
- 1411 E Ashlan Ave
- 1410 E Austin Way
- 1429 E Ashlan Ave
- 4227 N Del Mar Ave
- 1329 E Austin Way
- 1428 E Austin Way
- 4264 N Del Mar Ave
- 1347 E Austin Way
- 1409 E Austin Way
- 4249 N Del Mar Ave
- 1446 E Austin Way
- 1427 E Austin Way
- 1328 E Swift Ave
- 1310 E Swift Ave