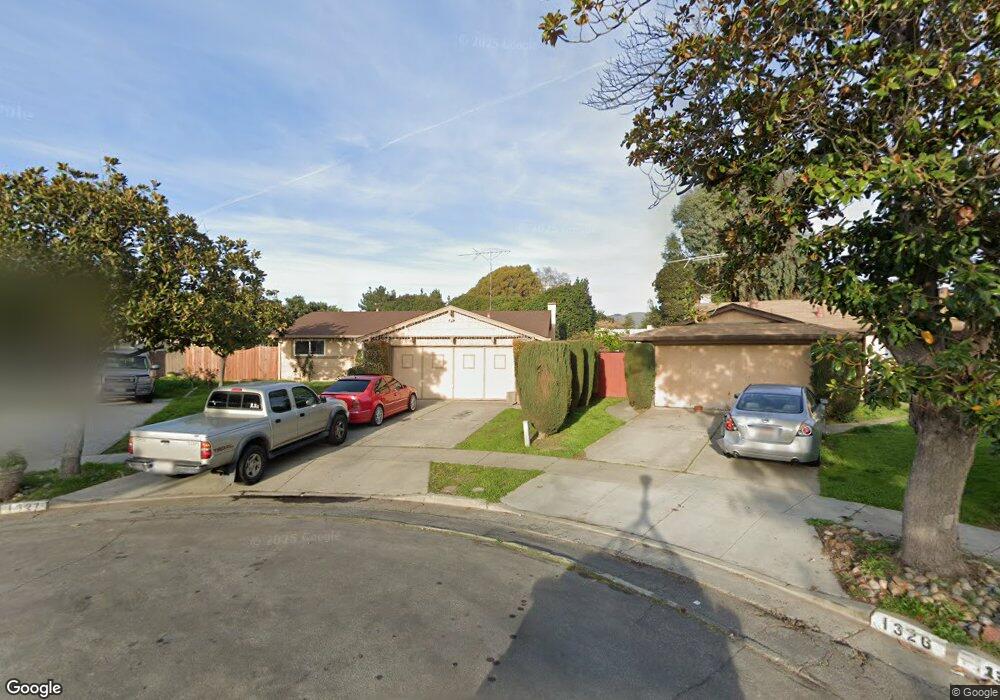
1327 Kane Ct San Jose, CA 95121
Stonegate NeighborhoodEstimated Value: $1,093,000 - $1,268,000
3
Beds
2
Baths
1,444
Sq Ft
$817/Sq Ft
Est. Value
About This Home
This home is located at 1327 Kane Ct, San Jose, CA 95121 and is currently estimated at $1,179,484, approximately $816 per square foot. 1327 Kane Ct is a home located in Santa Clara County with nearby schools including Windmill Springs Elementary School, Sylvandale Middle School, and Yerba Buena High School.
Ownership History
Date
Name
Owned For
Owner Type
Purchase Details
Closed on
Apr 21, 2015
Sold by
Barajas Vanesa Tapia and Tapia Osvaldo
Bought by
Barajas Vanesa Tapia and Arellano Gilberto Tapia
Current Estimated Value
Home Financials for this Owner
Home Financials are based on the most recent Mortgage that was taken out on this home.
Original Mortgage
$342,000
Outstanding Balance
$263,851
Interest Rate
3.8%
Mortgage Type
New Conventional
Estimated Equity
$915,633
Purchase Details
Closed on
Sep 11, 2012
Sold by
Tapia Karla F
Bought by
Tapia Osvaldo
Purchase Details
Closed on
Sep 22, 2008
Sold by
Swanson Paul A and Swanson Earl H
Bought by
Tapia Barajas Vanesa
Home Financials for this Owner
Home Financials are based on the most recent Mortgage that was taken out on this home.
Original Mortgage
$360,000
Interest Rate
6.31%
Mortgage Type
Purchase Money Mortgage
Purchase Details
Closed on
Aug 10, 2000
Sold by
Swanson Roy H and Swanson Mary L
Bought by
Swanson Roy H and Swanson Mary Louise
Create a Home Valuation Report for This Property
The Home Valuation Report is an in-depth analysis detailing your home's value as well as a comparison with similar homes in the area
Home Values in the Area
Average Home Value in this Area
Purchase History
| Date | Buyer | Sale Price | Title Company |
|---|---|---|---|
| Barajas Vanesa Tapia | $171,000 | Old Republic Title Co | |
| Tapi Gilberto | -- | Old Republic Title Company | |
| Tapia Osvaldo | -- | None Available | |
| Barajas Vanesa Tapia | $176,500 | None Available | |
| Tapia Barajas Vanesa | $400,000 | Stewart Title Of California | |
| Swanson Roy H | -- | -- |
Source: Public Records
Mortgage History
| Date | Status | Borrower | Loan Amount |
|---|---|---|---|
| Open | Barajas Vanesa Tapia | $342,000 | |
| Previous Owner | Tapia Barajas Vanesa | $360,000 |
Source: Public Records
Tax History Compared to Growth
Tax History
| Year | Tax Paid | Tax Assessment Tax Assessment Total Assessment is a certain percentage of the fair market value that is determined by local assessors to be the total taxable value of land and additions on the property. | Land | Improvement |
|---|---|---|---|---|
| 2025 | $7,983 | $515,085 | $309,055 | $206,030 |
| 2024 | $7,983 | $504,987 | $302,996 | $201,991 |
| 2023 | $7,870 | $495,086 | $297,055 | $198,031 |
| 2022 | $7,699 | $485,380 | $291,231 | $194,149 |
| 2021 | $7,648 | $475,864 | $285,521 | $190,343 |
| 2020 | $7,377 | $470,986 | $282,594 | $188,392 |
| 2019 | $7,075 | $461,752 | $277,053 | $184,699 |
| 2018 | $7,153 | $452,699 | $271,621 | $181,078 |
| 2017 | $7,059 | $443,824 | $266,296 | $177,528 |
| 2016 | $6,713 | $435,123 | $261,075 | $174,048 |
| 2015 | $6,576 | $428,589 | $257,154 | $171,435 |
| 2014 | $6,103 | $420,194 | $252,117 | $168,077 |
Source: Public Records
Map
Nearby Homes
- 3016 Shadow Springs Place Unit 113
- 2566 Boren Dr
- 2748 Aida Ave
- 2647 Aida Ave
- 3241 Shadow Park Place
- 3326 Shadow Park Place
- 3354 Shadow Park Place Unit 319
- 1051 Keldon Dr
- 2416 Balme Dr
- 1058 Tekman Dr Unit 58
- 1520 E Capitol Expy
- 1520 E Capitol Expy Unit 29
- 2154 Pastoral Loop
- 3463 Sugarcreek Ct
- 1868 Bagpipe Way
- 3262 Firth Way
- 2697 Lone Bluff Way
- 677 Dadis Way
- 653 Dadis Way
- 2175 Summerton Dr