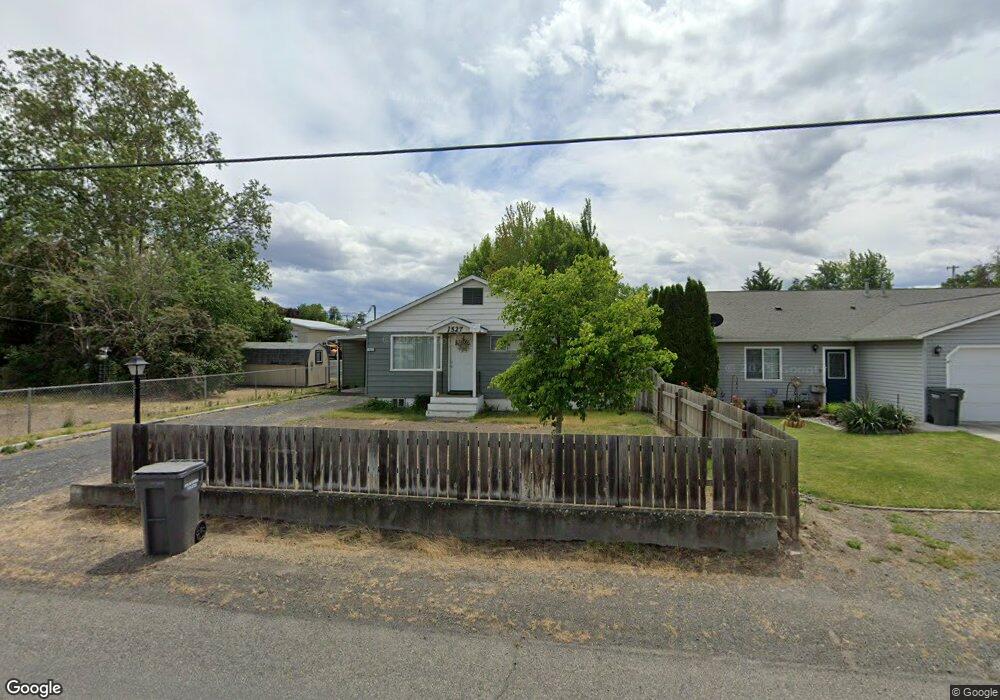
1327 Maple St Clarkston, WA 99403
Estimated Value: $234,000 - $269,000
2
Beds
1
Bath
924
Sq Ft
$274/Sq Ft
Est. Value
About This Home
This home is located at 1327 Maple St, Clarkston, WA 99403 and is currently estimated at $253,471, approximately $274 per square foot. 1327 Maple St is a home located in Asotin County with nearby schools including Grantham Elementary School, Lincoln Middle School, and Charles Francis Adams High School.
Ownership History
Date
Name
Owned For
Owner Type
Purchase Details
Closed on
Oct 22, 2020
Sold by
Kimball Tristan E
Bought by
Palmer Whitney
Current Estimated Value
Home Financials for this Owner
Home Financials are based on the most recent Mortgage that was taken out on this home.
Original Mortgage
$170,707
Outstanding Balance
$151,558
Interest Rate
2.8%
Mortgage Type
New Conventional
Estimated Equity
$101,913
Create a Home Valuation Report for This Property
The Home Valuation Report is an in-depth analysis detailing your home's value as well as a comparison with similar homes in the area
Home Values in the Area
Average Home Value in this Area
Purchase History
| Date | Buyer | Sale Price | Title Company |
|---|---|---|---|
| Palmer Whitney | $169,000 | Alliance Title Clarkston |
Source: Public Records
Mortgage History
| Date | Status | Borrower | Loan Amount |
|---|---|---|---|
| Open | Palmer Whitney | $170,707 |
Source: Public Records
Tax History Compared to Growth
Tax History
| Year | Tax Paid | Tax Assessment Tax Assessment Total Assessment is a certain percentage of the fair market value that is determined by local assessors to be the total taxable value of land and additions on the property. | Land | Improvement |
|---|---|---|---|---|
| 2025 | $1,584 | $151,500 | $30,000 | $121,500 |
| 2023 | $1,584 | $151,500 | $30,000 | $121,500 |
| 2022 | $1,672 | $151,500 | $30,000 | $121,500 |
| 2021 | $1,024 | $151,500 | $30,000 | $121,500 |
| 2020 | $950 | $89,900 | $25,000 | $64,900 |
| 2019 | $894 | $89,900 | $25,000 | $64,900 |
| 2018 | $1,098 | $89,900 | $25,000 | $64,900 |
| 2017 | $1,005 | $89,900 | $25,000 | $64,900 |
| 2016 | $1,005 | $89,900 | $25,000 | $64,900 |
| 2015 | $101 | $87,400 | $25,000 | $62,400 |
| 2013 | $1,022 | $85,600 | $25,000 | $60,600 |
Source: Public Records
Map
Nearby Homes
- NNA 13th St
- 811 14th St
- 1368 Chestnut St
- 1450 & 1454 Elm St
- 710 12th St
- 616 12th St
- 600 12th St
- 705 12th St
- 418 & 422 13th St
- 601 12th St
- 841 van Arsdol St
- 1383 Fair St Unit 11
- 1383 Fair St Unit 5
- 1383 Fair St Unit 7
- 1203 Sycamore St
- 600 11th St
- 1485 Sycamore St
- 532 10th St
- 929 10th St
- 829 Diagonal St