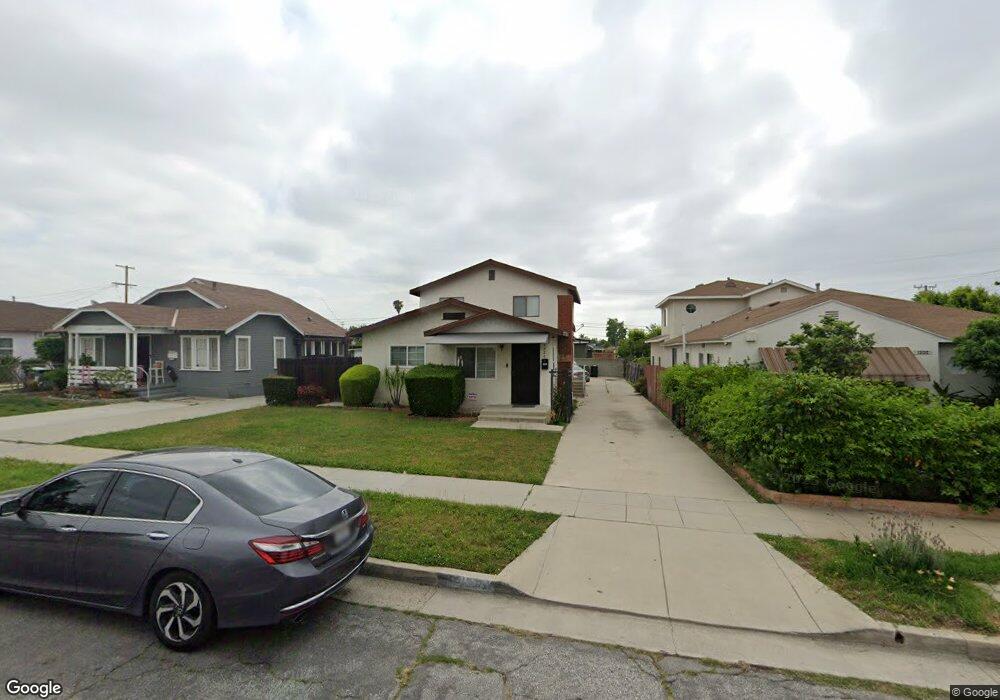
1328 S Primrose Ave Alhambra, CA 91803
Ethel Park NeighborhoodEstimated Value: $960,000 - $1,290,000
4
Beds
3
Baths
2,216
Sq Ft
$517/Sq Ft
Est. Value
About This Home
This home is located at 1328 S Primrose Ave, Alhambra, CA 91803 and is currently estimated at $1,146,275, approximately $517 per square foot. 1328 S Primrose Ave is a home located in Los Angeles County with nearby schools including Fremont Elementary School, Alhambra High School, and St. Thomas More Catholic Elementary School.
Ownership History
Date
Name
Owned For
Owner Type
Purchase Details
Closed on
Mar 27, 2021
Sold by
Le Dang Thanh
Bought by
Le Dang Thanh and Dang Nancy
Current Estimated Value
Purchase Details
Closed on
Apr 23, 2018
Sold by
Dang Thanh Le
Bought by
Dang Thanh Le
Home Financials for this Owner
Home Financials are based on the most recent Mortgage that was taken out on this home.
Original Mortgage
$170,000
Interest Rate
4.44%
Mortgage Type
New Conventional
Purchase Details
Closed on
Mar 24, 2006
Sold by
Dang Kathy Binh
Bought by
Dang Thanh Le
Purchase Details
Closed on
Jun 9, 2000
Sold by
Thanh Van Huynh
Bought by
Dang Kathy Binh
Purchase Details
Closed on
Mar 17, 1995
Sold by
Vanhuynh Quyen
Bought by
Vanhuynh Thanh
Purchase Details
Closed on
Sep 16, 1991
Sold by
Tang Tak
Bought by
Vanvanhuynh Quyen Van
Create a Home Valuation Report for This Property
The Home Valuation Report is an in-depth analysis detailing your home's value as well as a comparison with similar homes in the area
Home Values in the Area
Average Home Value in this Area
Purchase History
We collect this data history from publicly available records. To have your information removed, we recommend requesting removal directly through your county’s website.
| Date | Buyer | Sale Price | Title Company |
|---|---|---|---|
| Le Dang Thanh | -- | Accommodation/Courtesy Recordi | |
| Dang Thanh Le | -- | Wfg National Title Company O | |
| Dang Thanh Le | -- | Wfg National Title Company O | |
| Dang Thanh Le | -- | None Available | |
| Dang Kathy Binh | -- | -- | |
| Vanhuynh Thanh | -- | -- | |
| Vanvanhuynh Quyen Van | -- | -- |
Source: Public Records
Mortgage History
We collect this data history from publicly available records. To have your information removed, we recommend requesting removal directly through your county’s website.
| Date | Status | Borrower | Loan Amount |
|---|---|---|---|
| Previous Owner | Dang Thanh Le | $170,000 |
Source: Public Records
Tax History
| Year | Tax Paid | Tax Assessment Tax Assessment Total Assessment is a certain percentage of the fair market value that is determined by local assessors to be the total taxable value of land and additions on the property. | Land | Improvement |
|---|---|---|---|---|
| 2025 | $11,919 | $955,435 | $660,609 | $294,826 |
| 2024 | $11,564 | $936,702 | $647,656 | $289,046 |
| 2023 | $11,395 | $918,336 | $634,957 | $283,379 |
| 2022 | $10,838 | $900,330 | $622,507 | $277,823 |
| 2021 | $9,722 | $795,366 | $541,609 | $253,757 |
| 2019 | $9,376 | $771,778 | $525,546 | $246,232 |
| 2018 | $9,355 | $756,646 | $515,242 | $241,404 |
| 2016 | $8,588 | $727,267 | $495,236 | $232,031 |
| 2015 | $8,457 | $716,344 | $487,798 | $228,546 |
| 2014 | $8,272 | $696,000 | $474,000 | $222,000 |
Source: Public Records
Map
Nearby Homes
- 1342 Edgewood Dr
- 1608 Elm St
- 1305 S Ethel Ave
- 1100 S Ethel Ave
- 2904 Front St
- 1705 S Fremont Ave
- 2925 W Shorb St
- 1623 W Glendon Way
- 1405 Westminster Ave
- 2205 W Ramona Rd
- 1324 Milton Ave
- 1601 St Simon Cir Unit D
- 1414 W Shorb St
- 2148 Edgewood Dr
- 1607 Westmont Dr
- 600 La Paloma Ave
- 611 S Marguerita Ave
- 2121 El Paseo
- 2917 W Hellman Ave
- 1218 Edith Ave Unit E
- 1323 Edgewood Dr
- 1321 Edgewood Dr
- 1325 Edgewood Dr
- 1315 Edgewood Dr
- 1329 Edgewood Dr
- 1320 S Primrose Ave
- 1316 S Primrose Ave
- 1324 S Primrose Ave
- 1311 Edgewood Dr
- 1335 Edgewood Dr
- 1312 S Primrose Ave
- 1308 S Primrose Ave
- 1322 Edgewood Dr
- 1326 Edgewood Dr
- 1307 Edgewood Dr
- 1339 Edgewood Dr
- 1332 S Primrose Ave
- 1330 Edgewood Dr
- 1312 Edgewood Dr
- 1304 S Primrose Ave
Your Personal Tour Guide
Ask me questions while you tour the home.