1329 Delaware St Unit 1 Gary, IN 46407
Midtown NeighborhoodEstimated Value: $48,000 - $104,832
5
Beds
2
Baths
1,203
Sq Ft
$64/Sq Ft
Est. Value
About This Home
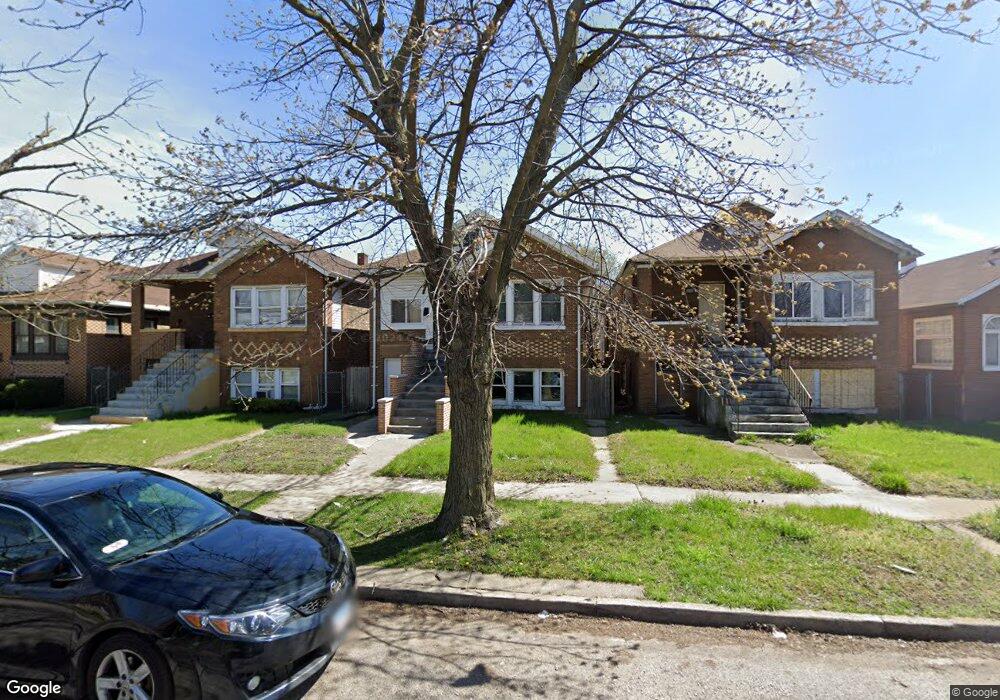
This home is located at 1329 Delaware St Unit 1, Gary, IN 46407 and is currently estimated at $76,958, approximately $63 per square foot. 1329 Delaware St Unit 1 is a home located in Lake County with nearby schools including Daniel Hale Williams Elementary School, Gary Middle School, and West Side Leadership Academy.
Ownership History
Date
Name
Owned For
Owner Type
Purchase Details
Closed on
Feb 26, 2021
Sold by
Serio Mohamed Bechir
Bought by
Spm Consulting Inc
Current Estimated Value
Purchase Details
Closed on
Feb 24, 2021
Sold by
Serio Mohamed Bechir
Bought by
Spm Consulting Inc
Purchase Details
Closed on
Feb 21, 2018
Sold by
Love Emma
Bought by
Love Emma and Love Dorrian
Purchase Details
Closed on
Aug 17, 2016
Sold by
Love Erma
Bought by
Love Emma and Love Dorrian
Purchase Details
Closed on
Apr 15, 2016
Sold by
Love Erma J
Bought by
Love Dorrian
Purchase Details
Closed on
Feb 4, 2015
Sold by
Love Erma
Bought by
Love Dorrian
Purchase Details
Closed on
Feb 21, 2014
Sold by
Love Emma and Love Dorrian
Bought by
Serio Mohamed Bechir
Purchase Details
Closed on
Mar 14, 2012
Sold by
Jones Timothy
Bought by
Love Erma
Create a Home Valuation Report for This Property
The Home Valuation Report is an in-depth analysis detailing your home's value as well as a comparison with similar homes in the area
Home Values in the Area
Average Home Value in this Area
Purchase History
| Date | Buyer | Sale Price | Title Company |
|---|---|---|---|
| Spm Consulting Inc | -- | Chicago Title Insurance Co | |
| Spm Consulting Inc | -- | Chicago Title | |
| Love Emma | -- | Chicago Title Insurance Co | |
| Love Emma | -- | None Available | |
| Love Dorrian | -- | None Available | |
| Love Dorrian | -- | None Available | |
| Serio Mohamed Bechir | -- | Chicago Title Insurance Co | |
| Love Erma | -- | None Available |
Source: Public Records
Tax History Compared to Growth
Tax History
| Year | Tax Paid | Tax Assessment Tax Assessment Total Assessment is a certain percentage of the fair market value that is determined by local assessors to be the total taxable value of land and additions on the property. | Land | Improvement |
|---|---|---|---|---|
| 2024 | $4,920 | $82,600 | $5,300 | $77,300 |
| 2023 | $1,289 | $55,800 | $5,300 | $50,500 |
| 2022 | $1,289 | $50,300 | $2,700 | $47,600 |
| 2021 | $843 | $46,500 | $2,700 | $43,800 |
| 2020 | $843 | $46,500 | $2,700 | $43,800 |
| 2019 | $744 | $46,500 | $2,700 | $43,800 |
| 2018 | $564 | $48,900 | $3,400 | $45,500 |
| 2017 | $1,126 | $49,300 | $3,400 | $45,900 |
| 2016 | $1,156 | $51,400 | $3,400 | $48,000 |
| 2014 | $1,767 | $75,500 | $3,400 | $72,100 |
| 2013 | $1,674 | $74,500 | $3,400 | $71,100 |
Source: Public Records
Map
Nearby Homes
- 1320 Delaware St
- 1433 Pennsylvania St
- 1104 Maryland St
- 1300 Carolina St
- 1715 Maryland St
- 824 E 15th Ave
- 1745 Maryland St
- 1924 Virginia St
- 400 E 20th Ave
- 1971 Massachusetts St
- 830 Georgia St
- 720 Maryland St
- 856 Kentucky St
- 713 Maryland St
- 1148 Jackson St
- 1545 Van Buren St
- 1123 - 1125 Van Buren St
- 1957 Madison Ln
- 1330 Van Buren St
- 864 Ohio St
- 1329 Delaware St
- 1325 Delaware St
- 1333 Delaware St
- 1321 Delaware St
- 1337 Delaware St
- 1319 Delaware St
- 1401 Delaware St
- 1313 Delaware St
- 1405 Delaware St
- 1330 Maryland St
- 1326 Maryland St
- 1334 Maryland St
- 1320 Maryland St
- 1309 Delaware St
- 1400 Maryland St
- 1328 Delaware St
- 1312 Maryland St
- 1332 Delaware St
- 1415 Delaware St
- 1336 Delaware St