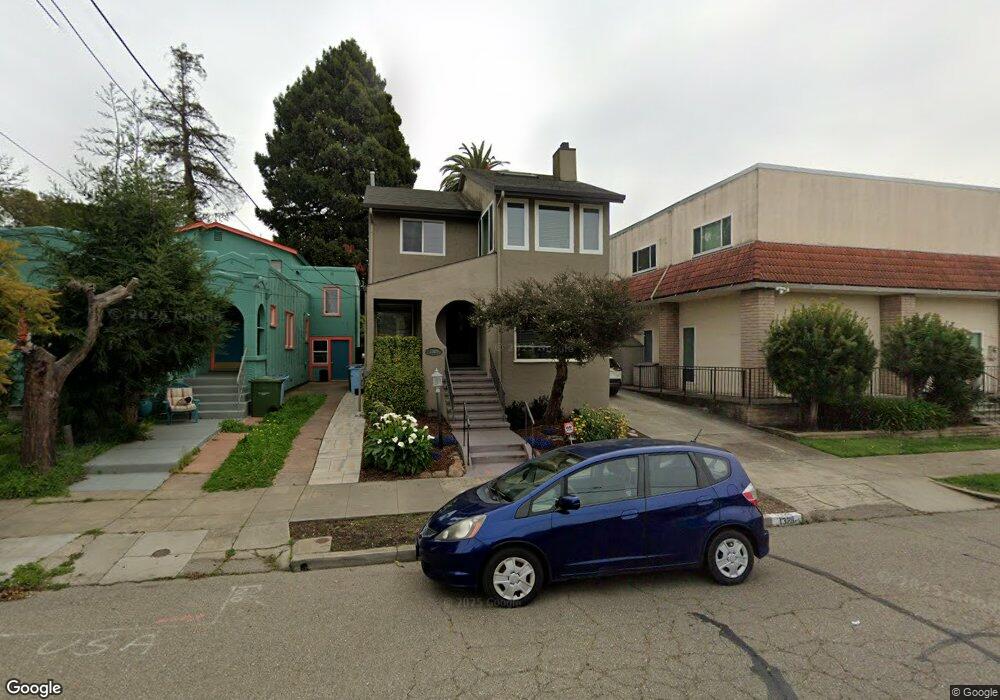
1329 Ordway St Berkeley, CA 94702
West Berkeley NeighborhoodEstimated Value: $1,601,000 - $2,434,000
4
Beds
3
Baths
2,419
Sq Ft
$786/Sq Ft
Est. Value
About This Home
This home is located at 1329 Ordway St, Berkeley, CA 94702 and is currently estimated at $1,901,607, approximately $786 per square foot. 1329 Ordway St is a home located in Alameda County with nearby schools including Ruth Acty Elementary, Thousand Oaks Elementary School, and Berkeley Arts Magnet at Whittier School.
Ownership History
Date
Name
Owned For
Owner Type
Purchase Details
Closed on
Dec 8, 2012
Sold by
Mornick Arlene H and Kornfield Joseph L
Bought by
Kornfeld Joseph L and Mornick Arlene H
Current Estimated Value
Home Financials for this Owner
Home Financials are based on the most recent Mortgage that was taken out on this home.
Original Mortgage
$417,000
Outstanding Balance
$283,452
Interest Rate
3.35%
Mortgage Type
New Conventional
Estimated Equity
$1,618,155
Purchase Details
Closed on
Apr 6, 2011
Sold by
Kornfeld Joseph L and Mornick Arlene H
Bought by
Kornfeld Joseph L and Mornick Arlene H
Purchase Details
Closed on
Mar 22, 2010
Sold by
Ferguson John M and Ferguson Kay V
Bought by
Kornfeld Joseph L and Mornick Arlene H
Home Financials for this Owner
Home Financials are based on the most recent Mortgage that was taken out on this home.
Original Mortgage
$225,000
Interest Rate
4.94%
Mortgage Type
New Conventional
Create a Home Valuation Report for This Property
The Home Valuation Report is an in-depth analysis detailing your home's value as well as a comparison with similar homes in the area
Home Values in the Area
Average Home Value in this Area
Purchase History
| Date | Buyer | Sale Price | Title Company |
|---|---|---|---|
| Kornfeld Joseph L | -- | Chicago Title Company | |
| Mornick Arlene H | -- | Chicago Title Company | |
| Kornfeld Joseph L | -- | None Available | |
| Kornfeld Joseph L | $979,000 | Chicago Title Company |
Source: Public Records
Mortgage History
| Date | Status | Borrower | Loan Amount |
|---|---|---|---|
| Open | Mornick Arlene H | $417,000 | |
| Closed | Kornfeld Joseph L | $225,000 |
Source: Public Records
Tax History
| Year | Tax Paid | Tax Assessment Tax Assessment Total Assessment is a certain percentage of the fair market value that is determined by local assessors to be the total taxable value of land and additions on the property. | Land | Improvement |
|---|---|---|---|---|
| 2025 | $18,972 | $1,256,624 | $379,087 | $884,537 |
| 2024 | $18,972 | $1,231,855 | $371,656 | $867,199 |
| 2023 | $18,583 | $1,214,566 | $364,370 | $850,196 |
| 2022 | $18,256 | $1,183,757 | $357,227 | $833,530 |
| 2021 | $18,306 | $1,160,417 | $350,225 | $817,192 |
| 2020 | $17,319 | $1,155,454 | $346,636 | $808,818 |
| 2019 | $16,637 | $1,132,800 | $339,840 | $792,960 |
| 2018 | $16,363 | $1,110,597 | $333,179 | $777,418 |
| 2017 | $15,816 | $1,088,823 | $326,647 | $762,176 |
| 2016 | $15,316 | $1,067,481 | $320,244 | $747,237 |
| 2015 | $15,113 | $1,051,455 | $315,436 | $736,019 |
| 2014 | $15,008 | $1,030,867 | $309,260 | $721,607 |
Source: Public Records
Map
Nearby Homes
- 1368 Rose St
- 1120 Curtis St
- 1631 Belvedere Ave
- 1127 Key Route Blvd
- 1322 Virginia St
- 1339 Kains Ave
- 1626 Hopkins St
- 1114 Talbot Ave
- 1036 Ramona Ave
- 1728 Curtis St
- 1504 10th St
- 1498 Sonoma Ave
- 1128 Delaware St
- 1050 Kains Ave Unit B1(3)
- 1919 Curtis St
- 995 Virginia St
- 1841 Vine St
- 1136 Marin Ave
- 1716 Hearst Ave
- 1425 Martin Luther King jr Way
- 1327 Ordway St
- 1347 Hopkins St
- 1325 Ordway St
- 1351 Hopkins St
- 1321 Ordway St
- 1317 Ordway St
- 1357 Hopkins St
- 1334 Ordway St
- 1332 Ordway St
- 1336 Ordway St
- 1338 Ordway St
- 1315 Ordway St
- 1320 Ordway St Unit D
- 1320 Ordway St Unit C
- 1320 Ordway St Unit B
- 1320 Ordway St Unit A
- 1326 Ordway St
- 1340 Ordway St
- 1350 Hopkins St
- 1348 Hopkins St
Your Personal Tour Guide
Ask me questions while you tour the home.