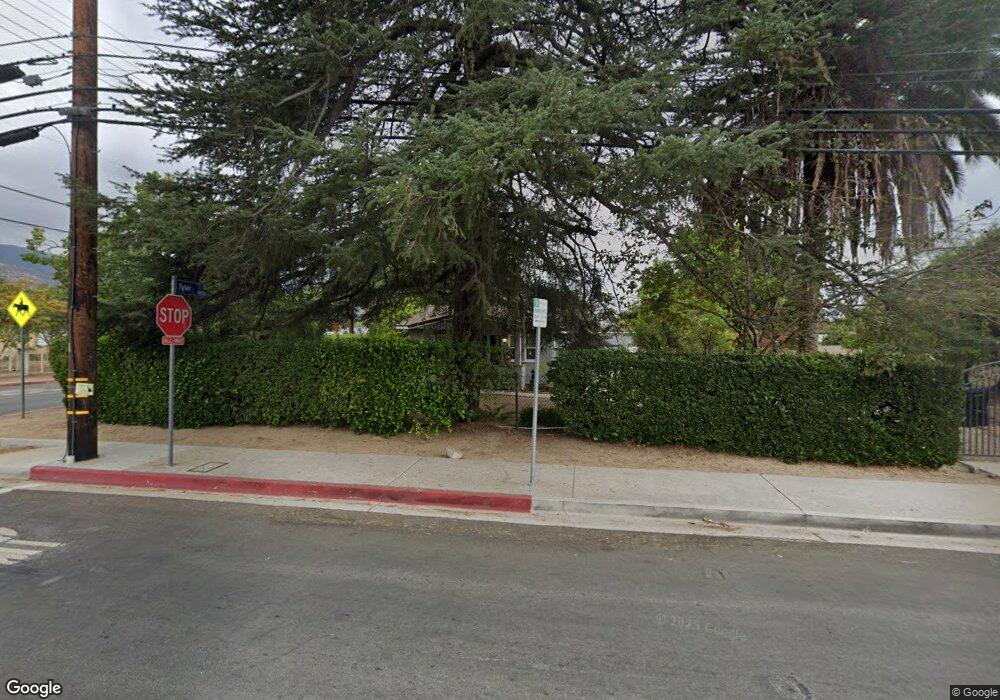
13298 Borden Ave Sylmar, CA 91342
Estimated Value: $800,000 - $972,000
3
Beds
2
Baths
1,092
Sq Ft
$800/Sq Ft
Est. Value
About This Home
This home is located at 13298 Borden Ave, Sylmar, CA 91342 and is currently estimated at $873,150, approximately $799 per square foot. 13298 Borden Ave is a home located in Los Angeles County with nearby schools including Sylmar Elementary School, Olive Vista Middle School, and San Fernando Senior High School.
Ownership History
Date
Name
Owned For
Owner Type
Purchase Details
Closed on
Jun 10, 2009
Sold by
Chavez Hutson Pamela S
Bought by
Chavez Hutson Pamela S and The Pamela S Chavez Hutson Trust
Current Estimated Value
Purchase Details
Closed on
Jan 31, 2003
Sold by
Zeimantz Patricia A and Chavez Hutson Pamela S
Bought by
Chavez Hutson Pamela S
Home Financials for this Owner
Home Financials are based on the most recent Mortgage that was taken out on this home.
Original Mortgage
$192,000
Outstanding Balance
$81,508
Interest Rate
5.83%
Estimated Equity
$791,642
Purchase Details
Closed on
Sep 1, 1999
Sold by
Sylmar Indoor Plants Inc
Bought by
Zeimantz Patricia A
Home Financials for this Owner
Home Financials are based on the most recent Mortgage that was taken out on this home.
Original Mortgage
$190,000
Interest Rate
7.97%
Create a Home Valuation Report for This Property
The Home Valuation Report is an in-depth analysis detailing your home's value as well as a comparison with similar homes in the area
Home Values in the Area
Average Home Value in this Area
Purchase History
| Date | Buyer | Sale Price | Title Company |
|---|---|---|---|
| Chavez Hutson Pamela S | -- | None Available | |
| Chavez Hutson Pamela S | -- | North American Title Co | |
| Zeimantz Patricia A | $212,000 | American Title Co |
Source: Public Records
Mortgage History
| Date | Status | Borrower | Loan Amount |
|---|---|---|---|
| Open | Chavez Hutson Pamela S | $192,000 | |
| Closed | Zeimantz Patricia A | $190,000 |
Source: Public Records
Tax History Compared to Growth
Tax History
| Year | Tax Paid | Tax Assessment Tax Assessment Total Assessment is a certain percentage of the fair market value that is determined by local assessors to be the total taxable value of land and additions on the property. | Land | Improvement |
|---|---|---|---|---|
| 2025 | $5,563 | $450,799 | $226,362 | $224,437 |
| 2024 | $5,563 | $441,961 | $221,924 | $220,037 |
| 2023 | $5,457 | $433,296 | $217,573 | $215,723 |
| 2022 | $5,209 | $424,801 | $213,307 | $211,494 |
| 2021 | $5,143 | $416,473 | $209,125 | $207,348 |
| 2019 | $4,992 | $404,122 | $202,923 | $201,199 |
| 2018 | $4,895 | $396,199 | $198,945 | $197,254 |
| 2016 | $4,675 | $380,817 | $191,221 | $189,596 |
| 2015 | $4,608 | $375,098 | $188,349 | $186,749 |
| 2014 | $4,639 | $367,751 | $184,660 | $183,091 |
Source: Public Records
Map
Nearby Homes
- 14401 Lakeside St
- 14523 Ryan St
- 15235 152351/2 Nurmi St
- 13108 Fellows Ave
- 13016 Jamie Ave
- 13007 Glenoaks Blvd
- 14344 Foothill Blvd Unit 306
- 14923 La Valle St
- 14291 Foothill Blvd Unit 11
- 14293 Foothill Blvd Unit 21
- 14293 Foothill Blvd Unit 19
- 14287 Foothill Blvd Unit 33
- 13656 Dronfield Ave
- 14325 Foothill Blvd Unit 34
- 14758 Lakeside St
- 14529 Paddock St
- 13009 Herrick Ave
- 14456 Foothill Blvd Unit 28
- 14456 Foothill Blvd Unit 43
- 13717 Deane Ln
- 13292 Borden Ave
- 13288 Borden Ave
- 14532 Tyler St
- 13302 Borden Ave
- 14545 Tyler St
- 13286 Borden Ave
- 14520 Tyler St
- 13304 Borden Ave
- 14581 Tyler St
- 13278 Borden Ave
- 13316 Borden Ave
- 14533 Tyler St
- 14514 Tyler St
- 14515 Tyler St
- 13270 Borden Ave
- 14508 Tyler St
- 13326 Borden Ave
- 14591 Tyler St
- 13315 Borden Ave
- 13321 Phillippi Ave