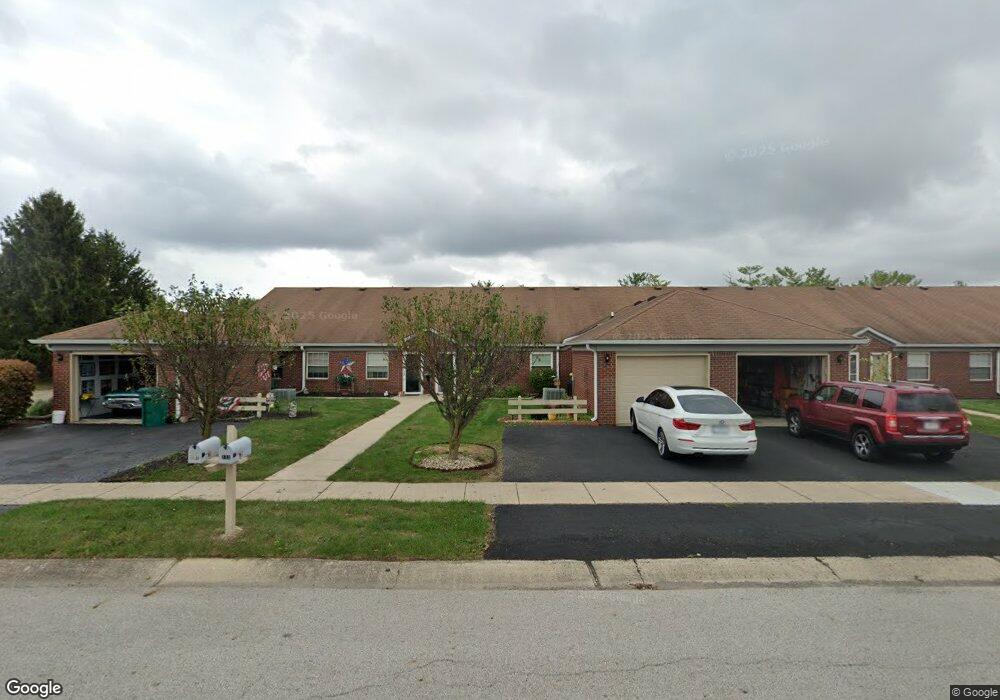
133 Andrews Blvd Plainfield, IN 46168
Estimated Value: $160,216 - $168,000
2
Beds
1
Bath
804
Sq Ft
$204/Sq Ft
Est. Value
About This Home
This home is located at 133 Andrews Blvd, Plainfield, IN 46168 and is currently estimated at $164,054, approximately $204 per square foot. 133 Andrews Blvd is a home located in Hendricks County with nearby schools including Central Elementary School, Plainfield Community Middle School, and Plainfield High School.
Ownership History
Date
Name
Owned For
Owner Type
Purchase Details
Closed on
Sep 4, 2020
Sold by
Burke Virginia Laraine
Bought by
Stephens Rita
Current Estimated Value
Purchase Details
Closed on
May 9, 2016
Sold by
Fedor John A and Fedor Shirley L
Bought by
Burke Virginia L
Purchase Details
Closed on
Jul 16, 2014
Sold by
Thornburg Randy J
Bought by
Fedor John A and Fedor Shirley L
Purchase Details
Closed on
May 8, 2007
Sold by
Keene Otis L and Keene Calvin L
Bought by
Grover Geoffrey A
Home Financials for this Owner
Home Financials are based on the most recent Mortgage that was taken out on this home.
Original Mortgage
$80,750
Interest Rate
6.27%
Mortgage Type
New Conventional
Purchase Details
Closed on
Apr 21, 2005
Sold by
Hoole Richard J and Hoole Mary Jane
Bought by
Keene Otis L and Keene Calvin L
Create a Home Valuation Report for This Property
The Home Valuation Report is an in-depth analysis detailing your home's value as well as a comparison with similar homes in the area
Home Values in the Area
Average Home Value in this Area
Purchase History
| Date | Buyer | Sale Price | Title Company |
|---|---|---|---|
| Stephens Rita | $110,000 | Meridian Title Corp | |
| Burke Virginia L | -- | -- | |
| Pitzer Donald M | -- | -- | |
| Fedor John A | -- | -- | |
| Grover Geoffrey A | -- | None Available | |
| Keene Otis L | -- | None Available |
Source: Public Records
Mortgage History
| Date | Status | Borrower | Loan Amount |
|---|---|---|---|
| Previous Owner | Grover Geoffrey A | $80,750 |
Source: Public Records
Tax History Compared to Growth
Tax History
| Year | Tax Paid | Tax Assessment Tax Assessment Total Assessment is a certain percentage of the fair market value that is determined by local assessors to be the total taxable value of land and additions on the property. | Land | Improvement |
|---|---|---|---|---|
| 2024 | $2,407 | $124,100 | $10,600 | $113,500 |
| 2023 | $2,409 | $120,900 | $10,100 | $110,800 |
| 2022 | $2,324 | $116,200 | $9,600 | $106,600 |
| 2021 | $2,004 | $100,200 | $9,600 | $90,600 |
| 2020 | $567 | $89,900 | $9,600 | $80,300 |
| 2019 | $559 | $89,900 | $9,600 | $80,300 |
| 2018 | $541 | $87,200 | $9,600 | $77,600 |
| 2017 | $492 | $81,600 | $8,900 | $72,700 |
| 2016 | $469 | $80,000 | $8,900 | $71,100 |
| 2014 | $413 | $79,500 | $8,800 | $70,700 |
Source: Public Records
Map
Nearby Homes
- 215 Andrews Boulevard East Dr
- 4181 Baranga Dr
- 251 Andrews Blvd
- 269 Andrews Boulevard East Dr
- 1042 W Main St
- 710 Hanna St
- 731 Andrews Blvd
- Foxhall Plan at Saratoga Village - Frontload
- Edinburgh Plan at Saratoga Village - Frontload
- Meridian III Plan at Saratoga Village - Rearload
- Madison Plan at Saratoga Village - Rearload
- Talbott II Plan at Saratoga Village - Rearload
- 5883 Farwell Ave
- 5875 Farwell Ave
- 5716 Kensington Blvd
- 4227 Washington Blvd
- 4088 Del Mar Ln
- 4261 Washington Blvd
- 4285 Washington Blvd
- 4252 Washington Blvd
- 133 Andrews Blvd
- 133 Andrews Blvd Unit 3
- 129 Andrews Blvd
- 173 Andrews Blvd
- 173 Andrews Blvd
- 173 Andrews Blvd
- 173 Andrews Blvd Unit 4
- 137 Andrews Blvd
- 137 Andrews Blvd
- 169 Andrews Blvd
- 169 Andrews Blvd Unit 6
- 177 Andrews Blvd Unit 2
- 177 Andrews Blvd
- 165 Andrews Blvd
- 125 Andrews Blvd
- 125 Andrews Blvd
- 125 Andrews Blvd Unit 7
- 121 Andrews Blvd
- 161 Andrews Blvd
- 161 Andrews Blvd Unit 10