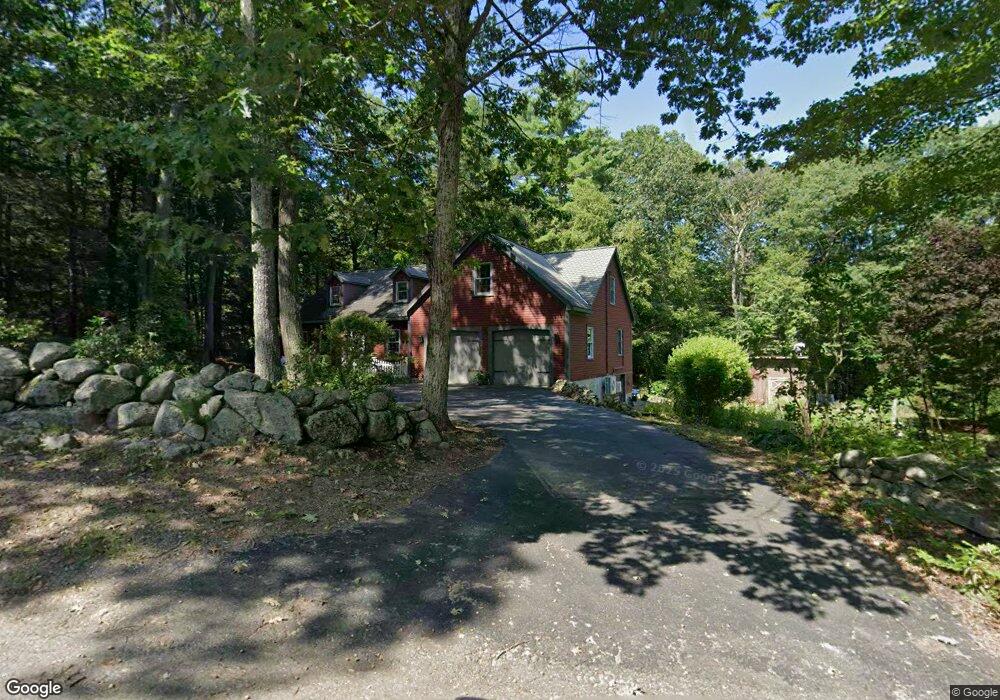
133 Fay Rd New Salem, MA 01355
New Salem NeighborhoodEstimated Value: $463,955 - $714,000
3
Beds
3
Baths
2,800
Sq Ft
$206/Sq Ft
Est. Value
About This Home
This home is located at 133 Fay Rd, New Salem, MA 01355 and is currently estimated at $575,989, approximately $205 per square foot. 133 Fay Rd is a home located in Franklin County with nearby schools including Swift River School and Ralph C Mahar Regional School.
Ownership History
Date
Name
Owned For
Owner Type
Purchase Details
Closed on
Aug 24, 1999
Sold by
Mackenzie Ned B and Mackenzie Johnna Beth
Bought by
Sakellarion Leo C and Sakellarion Marie T
Current Estimated Value
Home Financials for this Owner
Home Financials are based on the most recent Mortgage that was taken out on this home.
Original Mortgage
$40,000
Outstanding Balance
$11,450
Interest Rate
7.6%
Mortgage Type
Purchase Money Mortgage
Estimated Equity
$564,539
Purchase Details
Closed on
Apr 26, 1991
Sold by
Duley Robert E
Bought by
Mackenzie Ned B
Create a Home Valuation Report for This Property
The Home Valuation Report is an in-depth analysis detailing your home's value as well as a comparison with similar homes in the area
Home Values in the Area
Average Home Value in this Area
Purchase History
| Date | Buyer | Sale Price | Title Company |
|---|---|---|---|
| Sakellarion Leo C | $159,900 | -- | |
| Mackenzie Ned B | $20,000 | -- |
Source: Public Records
Mortgage History
| Date | Status | Borrower | Loan Amount |
|---|---|---|---|
| Open | Mackenzie Ned B | $40,000 | |
| Previous Owner | Mackenzie Ned B | $12,000 | |
| Previous Owner | Mackenzie Ned B | $96,500 | |
| Previous Owner | Mackenzie Ned B | $20,000 |
Source: Public Records
Tax History Compared to Growth
Tax History
| Year | Tax Paid | Tax Assessment Tax Assessment Total Assessment is a certain percentage of the fair market value that is determined by local assessors to be the total taxable value of land and additions on the property. | Land | Improvement |
|---|---|---|---|---|
| 2025 | $5,651 | $416,100 | $43,500 | $372,600 |
| 2024 | $4,889 | $340,200 | $43,500 | $296,700 |
| 2023 | $5,561 | $362,300 | $50,200 | $312,100 |
| 2022 | $5,489 | $290,100 | $50,200 | $239,900 |
| 2021 | $7,368 | $265,400 | $45,700 | $219,700 |
| 2020 | $7,052 | $265,400 | $45,700 | $219,700 |
| 2019 | $4,663 | $265,400 | $45,700 | $219,700 |
| 2018 | $7,004 | $264,800 | $44,200 | $220,600 |
| 2017 | $6,710 | $253,300 | $42,200 | $211,100 |
| 2016 | $4,364 | $253,300 | $42,200 | $211,100 |
| 2015 | $4,118 | $249,900 | $43,700 | $206,200 |
Source: Public Records
Map
Nearby Homes