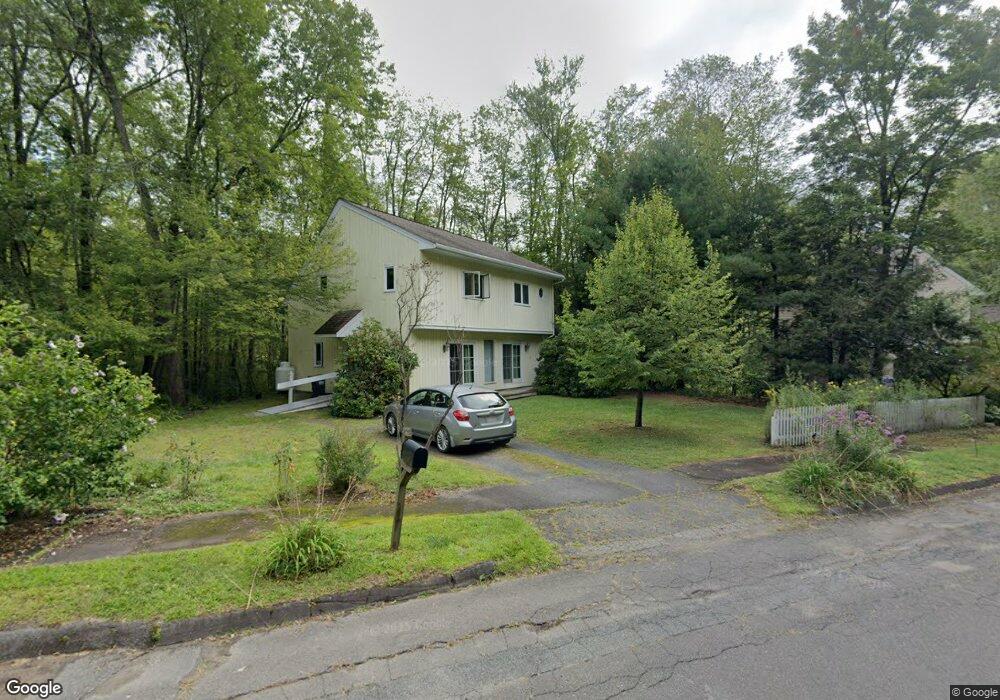
133 Maplewood Cir Amherst, MA 01002
Estimated Value: $503,000 - $513,000
3
Beds
2
Baths
1,517
Sq Ft
$334/Sq Ft
Est. Value
About This Home
This home is located at 133 Maplewood Cir, Amherst, MA 01002 and is currently estimated at $507,272, approximately $334 per square foot. 133 Maplewood Cir is a home located in Hampshire County with nearby schools including Wildwood Elementary School, Amherst Regional Middle School, and Amherst Regional High School.
Ownership History
Date
Name
Owned For
Owner Type
Purchase Details
Closed on
Jun 9, 2008
Sold by
Adler Lynn S and Warren Paige
Bought by
Almeida-Beveridge Joselyn and Beveridge Martin
Current Estimated Value
Home Financials for this Owner
Home Financials are based on the most recent Mortgage that was taken out on this home.
Original Mortgage
$238,150
Interest Rate
6.11%
Mortgage Type
Purchase Money Mortgage
Purchase Details
Closed on
Aug 6, 2004
Sold by
Oconnor Richard B and Oconnor Margaret D
Bought by
Adler Lynn S and Warren Paige
Home Financials for this Owner
Home Financials are based on the most recent Mortgage that was taken out on this home.
Original Mortgage
$200,000
Interest Rate
6.2%
Mortgage Type
Purchase Money Mortgage
Purchase Details
Closed on
Jan 29, 1997
Sold by
Liao Meei Ling and Sung Ta Cheng
Bought by
Oconnor Margaret D and Oconnor Richard B
Create a Home Valuation Report for This Property
The Home Valuation Report is an in-depth analysis detailing your home's value as well as a comparison with similar homes in the area
Home Values in the Area
Average Home Value in this Area
Purchase History
| Date | Buyer | Sale Price | Title Company |
|---|---|---|---|
| Almeida-Beveridge Joselyn | $300,950 | -- | |
| Adler Lynn S | $250,000 | -- | |
| Oconnor Margaret D | $111,000 | -- |
Source: Public Records
Mortgage History
| Date | Status | Borrower | Loan Amount |
|---|---|---|---|
| Open | Oconnor Margaret D | $230,000 | |
| Closed | Almeida-Beveridge Joselyn | $238,150 | |
| Previous Owner | Oconnor Margaret D | $200,000 | |
| Previous Owner | Oconnor Margaret D | $150,000 | |
| Previous Owner | Oconnor Margaret D | $87,900 |
Source: Public Records
Tax History Compared to Growth
Tax History
| Year | Tax Paid | Tax Assessment Tax Assessment Total Assessment is a certain percentage of the fair market value that is determined by local assessors to be the total taxable value of land and additions on the property. | Land | Improvement |
|---|---|---|---|---|
| 2025 | $69 | $385,200 | $187,600 | $197,600 |
| 2024 | $6,745 | $364,400 | $177,000 | $187,400 |
| 2023 | $6,390 | $317,900 | $161,000 | $156,900 |
| 2022 | $6,207 | $291,800 | $146,300 | $145,500 |
| 2021 | $5,907 | $270,700 | $135,500 | $135,200 |
| 2020 | $5,771 | $270,700 | $135,500 | $135,200 |
| 2019 | $5,644 | $258,900 | $135,500 | $123,400 |
| 2018 | $5,473 | $258,900 | $135,500 | $123,400 |
| 2017 | $5,320 | $243,700 | $129,100 | $114,600 |
| 2016 | $5,171 | $243,700 | $129,100 | $114,600 |
| 2015 | $5,006 | $243,700 | $129,100 | $114,600 |
Source: Public Records
Map
Nearby Homes
- 305 Strong St
- 0 Red Gate Ln Unit 73348273
- 161 Chestnut St
- 48 Gray St
- 65 N Prospect St
- 18 N Prospect St
- 11 Sheerman Ln
- 185 Cherry Ln
- 265 Stanley St
- 13 Harlow Dr
- 0 Heatherstone Rd
- 88 Farview Way
- Lot A Kingman Rd
- 110 Grantwood Dr
- 9 Harkness Rd
- 39 Valley Ln
- 14 Pebble Ridge Rd
- 61 S Valley Rd
- 96 Logtown Rd
- 0 Henry St
- 141 Maplewood Cir
- 134 Maplewood Cir
- 144 Maplewood Cir
- 38 Maplewood Cir
- 159 Maplewood Cir
- 20 Maplewood Dr
- 35 Maplewood Cir
- 265 Strong St
- 333 Strong St
- 286 Strong St
- 255 Strong St
- 5 Maplewood Dr
- 38 Maplewood Dr
- 50 Maplewood Dr
- 25 Maplewood Dr
- 60 Maplewood Dr
- 331 Strong St
- 1 Maplewood Dr
- 15 Maplewood Dr
- 233 Strong St