Estimated Value: $595,000 - $851,000
3
Beds
3
Baths
2,224
Sq Ft
$322/Sq Ft
Est. Value
About This Home
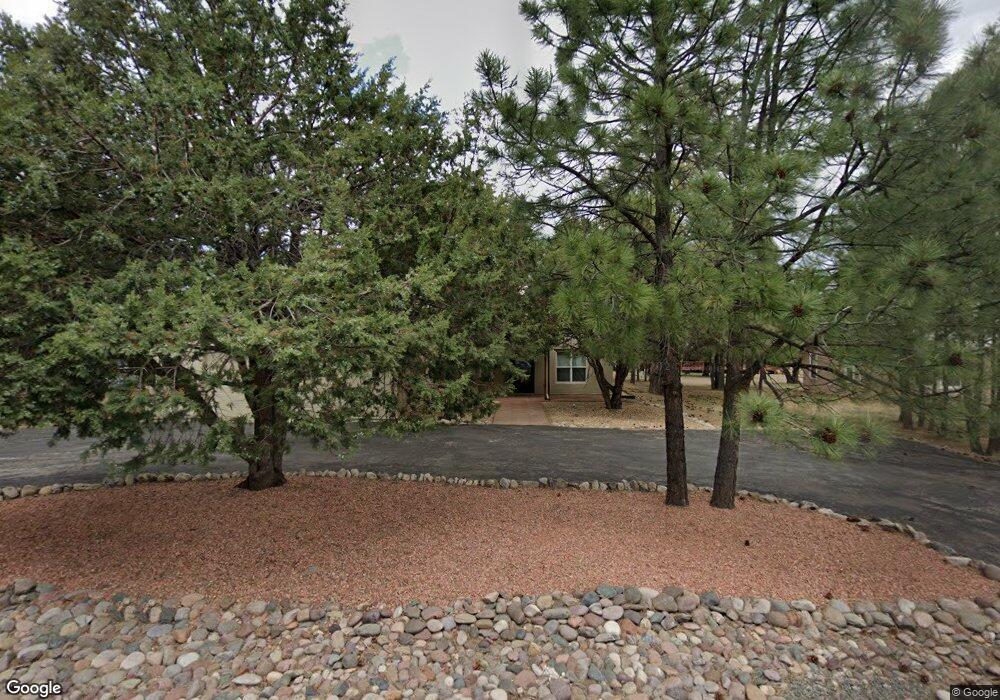
This home is located at 133 Mira Monte Rd Unit 1, Alto, NM 88312 and is currently estimated at $716,123, approximately $321 per square foot. 133 Mira Monte Rd Unit 1 is a home located in Lincoln County with nearby schools including Sierra Vista Primary School, White Mountain Elementary School, and Ruidoso Middle School.
Ownership History
Date
Name
Owned For
Owner Type
Purchase Details
Closed on
Jul 12, 2022
Sold by
Lindan Enterprises Llc
Bought by
Zone 10 Investors Llc
Current Estimated Value
Purchase Details
Closed on
Mar 3, 2021
Sold by
Starch Jean Ballard and Ballard Jean
Bought by
Lindan Enterprises Llc
Purchase Details
Closed on
Dec 17, 2013
Sold by
Ballard Jean
Bought by
Jean Ballard Family Trust and Ballard Jean
Purchase Details
Closed on
Sep 17, 2008
Sold by
Ballard James H and Ballard Jean
Bought by
Ballard Jean
Purchase Details
Closed on
Sep 16, 2008
Sold by
Baca Paublo J and Baca Karen L
Bought by
Ballard James H and James H Ballard Jr 2005 Revocable Trust
Purchase Details
Closed on
Jan 25, 2007
Sold by
Salazar Alejandro and Salazar Rose
Bought by
Baca Paublo J and Baca Karen L
Create a Home Valuation Report for This Property
The Home Valuation Report is an in-depth analysis detailing your home's value as well as a comparison with similar homes in the area
Home Values in the Area
Average Home Value in this Area
Purchase History
| Date | Buyer | Sale Price | Title Company |
|---|---|---|---|
| Zone 10 Investors Llc | -- | Johnson Gerald L | |
| Zone 10 Investors Llc | -- | Johnson Gerald L | |
| Lindan Enterprises Llc | -- | Alliance Abstract & Ttl Llc | |
| Jean Ballard Family Trust | -- | None Available | |
| Ballard Jean | -- | Gsv | |
| Ballard James H | -- | Gsv | |
| Baca Paublo J | -- | Gsv |
Source: Public Records
Tax History Compared to Growth
Tax History
| Year | Tax Paid | Tax Assessment Tax Assessment Total Assessment is a certain percentage of the fair market value that is determined by local assessors to be the total taxable value of land and additions on the property. | Land | Improvement |
|---|---|---|---|---|
| 2025 | $3,156 | $184,744 | $13,009 | $171,735 |
| 2024 | $3,156 | $184,744 | $13,009 | $171,735 |
| 2023 | $3,156 | $184,744 | $13,009 | $171,735 |
| 2022 | $2,334 | $152,499 | $13,009 | $139,490 |
| 2021 | $2,063 | $137,729 | $13,008 | $124,721 |
| 2020 | $2,290 | $133,717 | $12,629 | $121,088 |
| 2019 | $2,238 | $131,094 | $12,381 | $118,713 |
| 2018 | $2,165 | $127,275 | $12,020 | $115,255 |
| 2017 | $2,024 | $123,569 | $11,670 | $111,899 |
| 2015 | $2,096 | $123,581 | $11,671 | $111,910 |
| 2014 | $2,091 | $123,581 | $11,671 | $111,910 |
Source: Public Records
Map
Nearby Homes
- 127 Mira Monte Rd
- 1394 High Mesa Rd
- 136 Mira Monte Rd
- 1398 High Mesa Rd
- Lot 9(150) Mira Monte Rd
- Lot 33 Mira Monte Rd
- Lot 19 Twin Tree Loop
- 145 Mira Monte Rd
- 121 Twin Tree Loop
- 108 Twin Tree Loop
- 115 Twin Tree Loop
- 1377 High Mesa Dr
- 101 Eagle Ridge Rd Unit 1
- Lot 32 Eagle Ridge Rd
- 1410 High Mesa Dr
- Lot 6 Camino Dr
- 209 El Camino Dr
- 16 Eagle Ridge Rd
- 102 Eagle Ridge Rd
- 212 El Camino Dr
- 133 Mira Monte Rd
- 131 Mira Monte Rd Unit 1
- 135 Mira Monte Rd Unit 1
- 129 Mira Monte Rd
- 1396 High Mesa Rd
- 1392 1 High Mesa Dr
- 1392 High Mesa Rd Unit 1
- 127 Mira Monte Rd Unit 1
- 132 Mira Monte Rd
- 130 Mira Monte Rd Unit 1
- 1392 High Mesa Dr Unit 1
- 1390 High Mesa Rd
- 128 Mira Monte Rd
- 125 Mira Monte Rd Unit 1
- 102 Sage Rd Unit 1
- 1393 High Mesa Dr
- 1393 High Mesa Dr
- 1393 High Mesa Dr Unit 1
- 123 Mira Monte Rd
- 123 Mira Monte Rd Unit 1