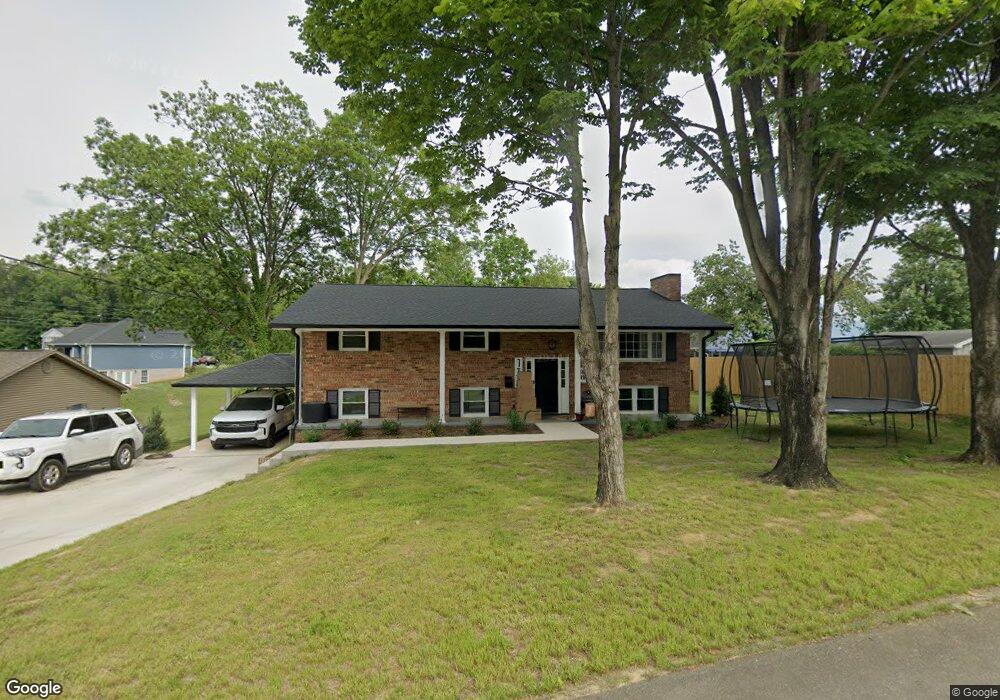
133 Pershing Ave Bristol, TN 37620
Estimated Value: $182,000 - $214,000
--
Bed
2
Baths
1,269
Sq Ft
$157/Sq Ft
Est. Value
About This Home
This home is located at 133 Pershing Ave, Bristol, TN 37620 and is currently estimated at $199,236, approximately $157 per square foot. 133 Pershing Ave is a home located in Sullivan County with nearby schools including Haynesfield Elementary School, Vance Middle School, and Tennessee High School.
Ownership History
Date
Name
Owned For
Owner Type
Purchase Details
Closed on
Mar 22, 2023
Sold by
Carl Adrian White I Trust
Bought by
Jsk Trust
Current Estimated Value
Home Financials for this Owner
Home Financials are based on the most recent Mortgage that was taken out on this home.
Original Mortgage
$140,000
Outstanding Balance
$135,445
Interest Rate
6.32%
Mortgage Type
Credit Line Revolving
Estimated Equity
$63,791
Purchase Details
Closed on
Aug 8, 2018
Sold by
Woodby Bobby Ray and Roe Frances
Bought by
The Carl Adrian White I Trust
Create a Home Valuation Report for This Property
The Home Valuation Report is an in-depth analysis detailing your home's value as well as a comparison with similar homes in the area
Home Values in the Area
Average Home Value in this Area
Purchase History
| Date | Buyer | Sale Price | Title Company |
|---|---|---|---|
| Jsk Trust | $150,000 | -- | |
| The Carl Adrian White I Trust | $50,000 | None Available |
Source: Public Records
Mortgage History
| Date | Status | Borrower | Loan Amount |
|---|---|---|---|
| Open | Jsk Trust | $140,000 |
Source: Public Records
Tax History Compared to Growth
Tax History
| Year | Tax Paid | Tax Assessment Tax Assessment Total Assessment is a certain percentage of the fair market value that is determined by local assessors to be the total taxable value of land and additions on the property. | Land | Improvement |
|---|---|---|---|---|
| 2025 | -- | $62,500 | $0 | $0 |
| 2024 | -- | $32,225 | $2,075 | $30,150 |
| 2023 | $1,415 | $32,225 | $2,075 | $30,150 |
| 2022 | $1,415 | $32,225 | $2,075 | $30,150 |
| 2021 | $1,415 | $32,225 | $2,075 | $30,150 |
| 2020 | $720 | $32,225 | $2,075 | $30,150 |
| 2019 | $1,325 | $28,000 | $2,075 | $25,925 |
| 2018 | $1,319 | $28,000 | $2,075 | $25,925 |
| 2017 | $1,319 | $28,000 | $2,075 | $25,925 |
| 2016 | $1,192 | $24,700 | $2,075 | $22,625 |
| 2014 | $1,125 | $24,699 | $0 | $0 |
Source: Public Records
Map
Nearby Homes
- 1520 Tremont Ave
- 116 Eastside Dr
- 101 Queen St
- 1713 Edgemont Ave
- 105 Lowry Ln
- 504 W Cedar St
- 921 Edgemont Ave Unit 1-2
- 115 Belmont Dr Unit B4
- 305 Belmont Dr
- 105 Pemberton Ct
- 1309 Indian Hills Dr
- 120 Rex Rd
- 1116 5th St
- 412 Merriwood Dr
- 109 Penrod Rd
- 577 English St
- 310 Knob Hill Dr
- 103 Skyline Dr
- 359 Vance Dr
- 116 W Crown