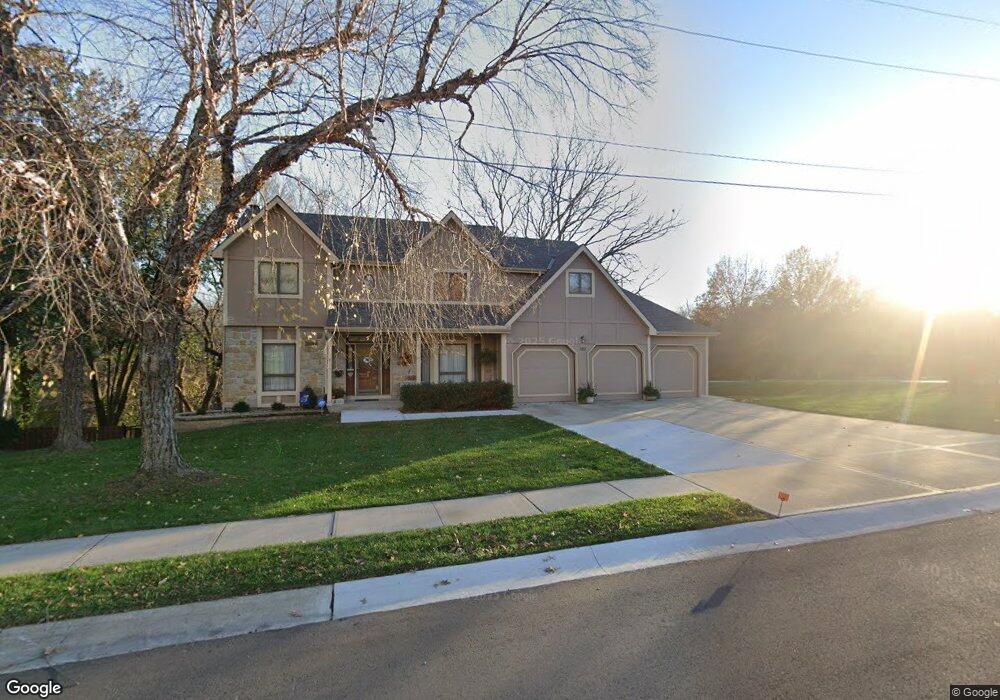
133 Willow Dr Lansing, KS 66043
Estimated Value: $423,000 - $455,000
4
Beds
5
Baths
2,478
Sq Ft
$178/Sq Ft
Est. Value
About This Home
This home is located at 133 Willow Dr, Lansing, KS 66043 and is currently estimated at $440,264, approximately $177 per square foot. 133 Willow Dr is a home located in Leavenworth County with nearby schools including Lansing Elementary School, Lansing Middle 6-8, and Lansing High 9-12.
Ownership History
Date
Name
Owned For
Owner Type
Purchase Details
Closed on
Oct 1, 2001
Bought by
Nickels Marvin L and Nickels Leslie A
Current Estimated Value
Home Financials for this Owner
Home Financials are based on the most recent Mortgage that was taken out on this home.
Original Mortgage
$164,000
Interest Rate
6.72%
Mortgage Type
New Conventional
Create a Home Valuation Report for This Property
The Home Valuation Report is an in-depth analysis detailing your home's value as well as a comparison with similar homes in the area
Home Values in the Area
Average Home Value in this Area
Purchase History
| Date | Buyer | Sale Price | Title Company |
|---|---|---|---|
| Nickels Marvin L | $240,000 | -- |
Source: Public Records
Mortgage History
| Date | Status | Borrower | Loan Amount |
|---|---|---|---|
| Closed | Nickels Marvin L | $164,000 | |
| Closed | Nickels Marvin L | $195,300 |
Source: Public Records
Tax History
| Year | Tax Paid | Tax Assessment Tax Assessment Total Assessment is a certain percentage of the fair market value that is determined by local assessors to be the total taxable value of land and additions on the property. | Land | Improvement |
|---|---|---|---|---|
| 2025 | $6,549 | $50,232 | $6,880 | $43,352 |
| 2024 | $6,306 | $48,300 | $6,880 | $41,420 |
| 2023 | $6,306 | $48,300 | $6,880 | $41,420 |
| 2022 | $6,085 | $44,068 | $6,713 | $37,355 |
| 2021 | $5,729 | $39,687 | $6,713 | $32,974 |
| 2020 | $5,431 | $37,030 | $6,713 | $30,317 |
| 2019 | $5,438 | $37,030 | $6,713 | $30,317 |
| 2018 | $5,320 | $36,246 | $6,713 | $29,533 |
| 2017 | $5,175 | $35,190 | $6,713 | $28,477 |
| 2016 | $5,178 | $35,190 | $6,713 | $28,477 |
| 2015 | $5,053 | $34,453 | $6,713 | $27,740 |
| 2014 | $4,826 | $33,599 | $6,713 | $26,886 |
Source: Public Records
Map
Nearby Homes
- 111 Southfork Rd
- 189 Canyon View Dr
- 875 Clearview Dr
- 1322 Rock Creek Ct
- 922 Southfork St
- 898 Clearview Dr
- 1221 S Desoto Rd
- 811 4-H Rd
- 24431 139th St
- 13965 Mc Intyre Rd
- 13788 McIntyre1 Rd
- 13788 Mcintyre Rd
- 13788 McIntyre2 Rd
- 26731 147th St
- 202 S Main St
- 124 S Main St
- 130 Hampton Ct
- 218 E Kay St
- 20958 Ida St
- 129 Crestview Ct
Your Personal Tour Guide
Ask me questions while you tour the home.