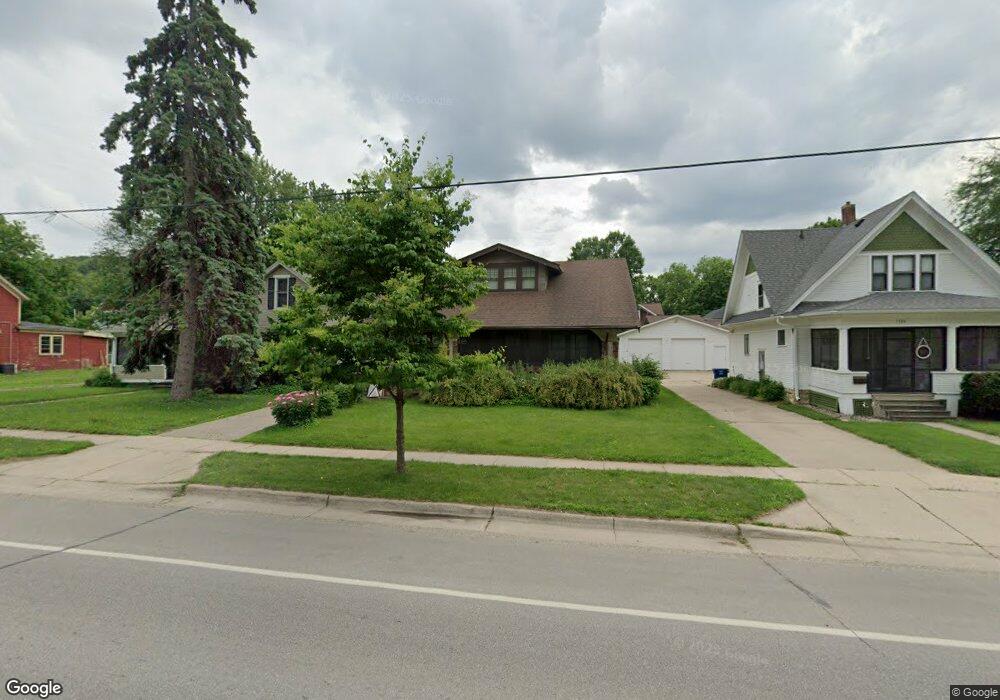
1330 Bush St Red Wing, MN 55066
Estimated Value: $242,477 - $281,000
4
Beds
2
Baths
2,000
Sq Ft
$129/Sq Ft
Est. Value
About This Home
This home is located at 1330 Bush St, Red Wing, MN 55066 and is currently estimated at $258,619, approximately $129 per square foot. 1330 Bush St is a home located in Goodhue County with nearby schools including Sunnyside Elementary School, Burnside Elementary School, and Twin Bluff Middle School.
Ownership History
Date
Name
Owned For
Owner Type
Purchase Details
Closed on
Aug 24, 2021
Sold by
Crandall John C
Bought by
Landa Brittney E and Landa Jorge L
Current Estimated Value
Home Financials for this Owner
Home Financials are based on the most recent Mortgage that was taken out on this home.
Original Mortgage
$213,750
Outstanding Balance
$194,072
Interest Rate
2.8%
Mortgage Type
New Conventional
Estimated Equity
$64,547
Create a Home Valuation Report for This Property
The Home Valuation Report is an in-depth analysis detailing your home's value as well as a comparison with similar homes in the area
Home Values in the Area
Average Home Value in this Area
Purchase History
| Date | Buyer | Sale Price | Title Company |
|---|---|---|---|
| Landa Brittney E | $225,000 | Dca Title | |
| Landa Brittney Brittney | $225,000 | -- |
Source: Public Records
Mortgage History
| Date | Status | Borrower | Loan Amount |
|---|---|---|---|
| Open | Landa Brittney E | $213,750 | |
| Closed | Landa Brittney Brittney | $213,750 |
Source: Public Records
Tax History
| Year | Tax Paid | Tax Assessment Tax Assessment Total Assessment is a certain percentage of the fair market value that is determined by local assessors to be the total taxable value of land and additions on the property. | Land | Improvement |
|---|---|---|---|---|
| 2025 | $2,062 | $181,600 | $31,900 | $149,700 |
| 2024 | -- | $178,700 | $31,900 | $146,800 |
| 2023 | $2,600 | $169,200 | $31,900 | $137,300 |
| 2022 | $1,792 | $168,200 | $31,900 | $136,300 |
| 2021 | $1,638 | $140,700 | $28,100 | $112,600 |
| 2020 | $1,724 | $132,100 | $28,100 | $104,000 |
| 2019 | $1,666 | $129,900 | $28,100 | $101,800 |
| 2018 | $1,288 | $127,700 | $25,500 | $102,200 |
| 2017 | $1,252 | $111,500 | $25,500 | $86,000 |
| 2016 | $1,130 | $110,000 | $25,500 | $84,500 |
| 2015 | $1,074 | $105,700 | $25,500 | $80,200 |
| 2014 | -- | $101,300 | $25,500 | $75,800 |
Source: Public Records
Map
Nearby Homes
- 1547 Bush St
- 1218 East Ave
- XXXX Skyline Heights
- 759 Plum St
- 1315 12th St
- 418 8th St
- 528 20th St
- 402 W 7th St
- 320 W 7th St
- 1003 Central Ave
- 613 Potter St
- 121 W 6th St
- 814 Central Ave
- 103 W 6th St
- 225 E 5th St
- 1218 Central Ave
- 818 Hawthorne St
- 222 Bush St Unit 402
- 222 Bush St Unit 302
- 222 Bush St Unit 404
Your Personal Tour Guide
Ask me questions while you tour the home.