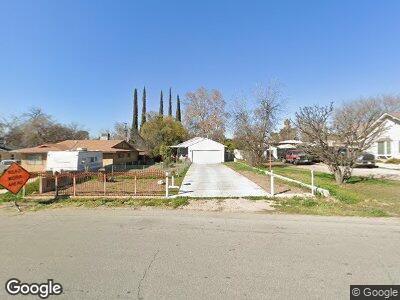
1330 Catalpa Way Bakersfield, CA 93306
Hillcrest NeighborhoodEstimated Value: $243,000 - $311,000
3
Beds
1
Bath
1,270
Sq Ft
$218/Sq Ft
Est. Value
About This Home
This home is located at 1330 Catalpa Way, Bakersfield, CA 93306 and is currently estimated at $276,719, approximately $217 per square foot. 1330 Catalpa Way is a home located in Kern County with nearby schools including Horace Mann Elementary School, Emerson Middle School, and East Bakersfield High School.
Ownership History
Date
Name
Owned For
Owner Type
Purchase Details
Closed on
Jun 2, 2011
Sold by
Flores Hugo
Bought by
Flores Cruz P
Current Estimated Value
Home Financials for this Owner
Home Financials are based on the most recent Mortgage that was taken out on this home.
Original Mortgage
$61,402
Outstanding Balance
$43,613
Interest Rate
4.75%
Mortgage Type
FHA
Estimated Equity
$222,771
Purchase Details
Closed on
Nov 18, 2010
Sold by
Citimortgage Inc
Bought by
The Secretary Of Housing & Urban Develop
Purchase Details
Closed on
Sep 23, 2002
Sold by
Riano Carlos M and Riano Thelma L
Bought by
Keaveny Patrick S
Home Financials for this Owner
Home Financials are based on the most recent Mortgage that was taken out on this home.
Original Mortgage
$101,097
Interest Rate
5.99%
Mortgage Type
FHA
Create a Home Valuation Report for This Property
The Home Valuation Report is an in-depth analysis detailing your home's value as well as a comparison with similar homes in the area
Home Values in the Area
Average Home Value in this Area
Purchase History
| Date | Buyer | Sale Price | Title Company |
|---|---|---|---|
| Flores Cruz P | -- | Chicago Title Company | |
| Flores Cruz P | $63,000 | Chicago Title Company | |
| The Secretary Of Housing & Urban Develop | -- | Cr Title Services Inc | |
| Citimortgage Inc | $98,700 | Cr Title Services Inc | |
| Keaveny Patrick S | $102,000 | Chicago Title |
Source: Public Records
Mortgage History
| Date | Status | Borrower | Loan Amount |
|---|---|---|---|
| Open | Flores Cruz P | $61,402 | |
| Previous Owner | Keaveny Patrick | $31,382 | |
| Previous Owner | Keaveny Patrick S | $18,662 | |
| Previous Owner | Keaveny Patrick S | $101,097 |
Source: Public Records
Tax History Compared to Growth
Tax History
| Year | Tax Paid | Tax Assessment Tax Assessment Total Assessment is a certain percentage of the fair market value that is determined by local assessors to be the total taxable value of land and additions on the property. | Land | Improvement |
|---|---|---|---|---|
| 2024 | $1,737 | $79,119 | $31,396 | $47,723 |
| 2023 | $1,737 | $77,569 | $30,781 | $46,788 |
| 2022 | $1,650 | $76,049 | $30,178 | $45,871 |
| 2021 | $1,554 | $74,559 | $29,587 | $44,972 |
| 2020 | $1,517 | $73,795 | $29,284 | $44,511 |
| 2019 | $1,462 | $73,795 | $29,284 | $44,511 |
| 2018 | $1,421 | $70,932 | $28,148 | $42,784 |
| 2017 | $1,401 | $69,543 | $27,597 | $41,946 |
| 2016 | $1,210 | $68,180 | $27,056 | $41,124 |
| 2015 | $1,205 | $67,157 | $26,650 | $40,507 |
| 2014 | $1,159 | $65,842 | $26,128 | $39,714 |
Source: Public Records
Map
Nearby Homes
- 2610 Niles St
- 1615 Camino Primavera
- 2717 Monterey St
- 2826 Primera Vista
- 2512 Niles St
- 1704 Camino Primavera
- 2801 Lake St
- 2509 Monterey St
- 1717 Camino Sierra
- 2332 Oregon Dr
- 909 Pentz St
- 2331 Oregon Dr
- 1764 Camino Primavera
- 2414 Kentucky St
- 2618 Security Ave
- 1505 Glenwood Dr
- 2729 Security Ave
- 2625 Security Ave
- 2904 Glenwood Cir
- 1800 Country Club Dr
- 1330 Catalpa Way
- 1338 Catalpa Way
- 1328 Catalpa Way
- 1340 Catalpa Way
- 1322 Catalpa Way
- 1350 Catalpa Way
- 1314 Catalpa Way
- 1615 Camino Sierra
- 1360 Catalpa Way
- 2607 Avenida Escuela
- 1621 Camino Sierra
- 2605 Avenida Escuela
- 1601 Camino Sierra
- 1625 Camino Sierra
- 2626 Niles St
- 1525 Camino Sierra
- 2624 Niles St
- 1627 Camino Sierra
- 1517 Camino Sierra
- 2601 Avenida Escuela