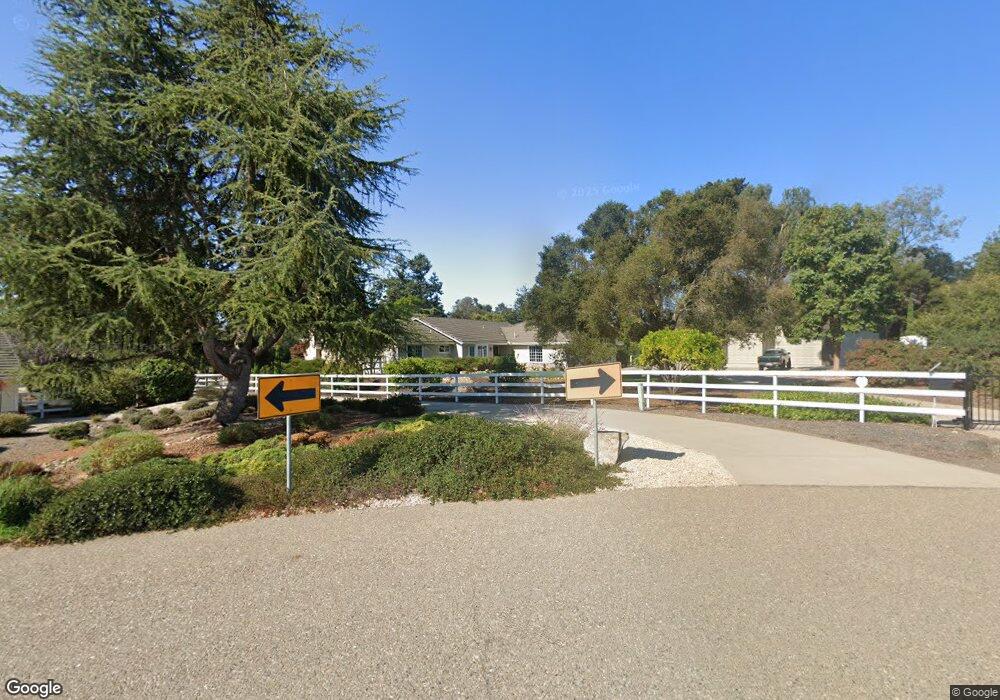
1330 Lassen Dr Nipomo, CA 93444
Estimated Value: $873,000 - $1,084,000
3
Beds
2
Baths
1,800
Sq Ft
$548/Sq Ft
Est. Value
About This Home
This home is located at 1330 Lassen Dr, Nipomo, CA 93444 and is currently estimated at $986,482, approximately $548 per square foot. 1330 Lassen Dr is a home located in San Luis Obispo County with nearby schools including Dorothea Lange Elementary School, Mesa Middle School, and Nipomo High School.
Ownership History
Date
Name
Owned For
Owner Type
Purchase Details
Closed on
Jun 30, 2015
Sold by
Ruiz Roland and Ruiz Debra V
Bought by
Ruiz Debra Vogel
Current Estimated Value
Purchase Details
Closed on
Apr 26, 2001
Sold by
Ignatiuk Georg and Dupont Alec
Bought by
Ruiz Roland and Ruiz Debra
Home Financials for this Owner
Home Financials are based on the most recent Mortgage that was taken out on this home.
Original Mortgage
$275,000
Outstanding Balance
$103,597
Interest Rate
7.15%
Estimated Equity
$882,885
Purchase Details
Closed on
Jul 20, 1999
Sold by
Terrence B Flatley Inc
Bought by
Ignatiuk Georg
Home Financials for this Owner
Home Financials are based on the most recent Mortgage that was taken out on this home.
Original Mortgage
$200,000
Interest Rate
7.63%
Mortgage Type
Balloon
Create a Home Valuation Report for This Property
The Home Valuation Report is an in-depth analysis detailing your home's value as well as a comparison with similar homes in the area
Home Values in the Area
Average Home Value in this Area
Purchase History
| Date | Buyer | Sale Price | Title Company |
|---|---|---|---|
| Ruiz Debra Vogel | -- | None Available | |
| Ruiz Roland | $400,000 | Cuesta Title Company | |
| Ignatiuk Georg | $269,500 | First American Title Co |
Source: Public Records
Mortgage History
| Date | Status | Borrower | Loan Amount |
|---|---|---|---|
| Open | Ruiz Roland | $275,000 | |
| Previous Owner | Ignatiuk Georg | $200,000 |
Source: Public Records
Tax History Compared to Growth
Tax History
| Year | Tax Paid | Tax Assessment Tax Assessment Total Assessment is a certain percentage of the fair market value that is determined by local assessors to be the total taxable value of land and additions on the property. | Land | Improvement |
|---|---|---|---|---|
| 2025 | $7,178 | $704,960 | $271,220 | $433,740 |
| 2024 | $7,094 | $691,138 | $265,902 | $425,236 |
| 2023 | $7,094 | $677,588 | $260,689 | $416,899 |
| 2022 | $6,256 | $595,676 | $255,578 | $340,098 |
| 2021 | $6,243 | $583,997 | $250,567 | $333,430 |
| 2020 | $6,171 | $578,010 | $247,998 | $330,012 |
| 2019 | $6,132 | $566,678 | $243,136 | $323,542 |
| 2018 | $6,057 | $555,568 | $238,369 | $317,199 |
| 2017 | $5,942 | $544,676 | $233,696 | $310,980 |
| 2016 | $5,603 | $533,997 | $229,114 | $304,883 |
| 2015 | $5,424 | $516,797 | $225,673 | $291,124 |
| 2014 | $5,221 | $506,675 | $221,253 | $285,422 |
Source: Public Records
Map
Nearby Homes
- 468 Neptune Dr
- 1655 Kirby Way
- 1180 Starlite Dr
- 1431 La Loma Dr
- 1127 Starlite Dr
- 393 Uranus Ct
- 426 Polaris Dr
- 457 Polaris Dr
- 945 Jeanette Ln
- 840 Story St
- 261 Hazel Ln
- 1765 Division St
- 522 Higos Way
- 725 Monarch Ln
- 483 Violet Ave
- 232 Scarlett Cir
- 626 Juno Ct
- Mesa Plan at Hill Street Terraces - Hill Street Series
- Pacific Plan at Hill Street Terraces - Hill Street Series
- Monarch Plan at Hill Street Terraces - Hill Street Series
- 550 High Meadow Dr
- 1397 Division St
- 1395 Division St
- 1377 Division St
- 590 High Meadow Dr
- 575 High Meadow Dr
- 1320 Lassen Dr
- 1326 Lassen Dr
- 525 Shiffrar Ln
- 664 Tyrus Ct
- 648 Tyrus Ct
- 616 Tyrus Ct
- 616 High Meadow Dr
- 1420 Division St
- 545 Shiffrar Ln
- 590 Tyrus Ct
- 1323 Lassen Dr
- 505 Shiffrar Ln
- 565 Shiffrar Ln
- 550 Tyrus Ct